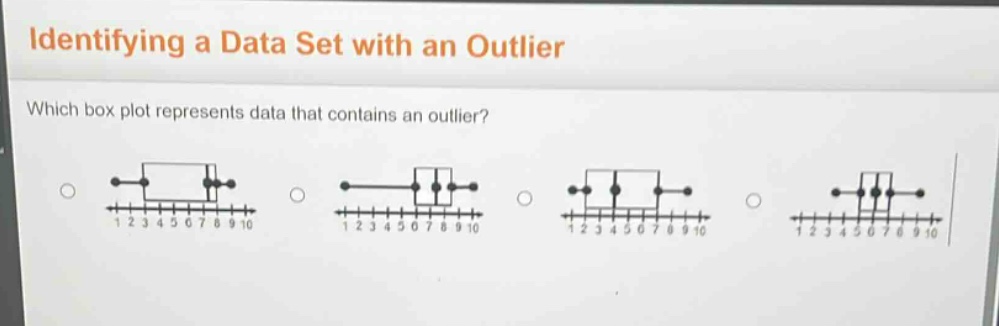
identifying a data set with an outlier\nwhich box plot represents data that contains an outlier?
identifying a data set with an outlier\nwhich box plot represents data that contains an outlier?
Answer
Explanation:
Step1: Recall outlier rule in box - plot
In a box - plot, an outlier is a data point that is more than 1.5 times the inter - quartile range (IQR) away from either the first quartile ($Q_1$) or the third quartile ($Q_3$). Visually, outliers are represented as individual points outside the whiskers of the box - plot.
Step2: Examine each box - plot
For the first box - plot, all points are within the whiskers. For the second box - plot, all points are within the whiskers. For the third box - plot, there is a point to the left of the left - hand whisker, which indicates an outlier. For the fourth box - plot, all points are within the whiskers.
Answer:
The third box - plot.