an indoor running track is 200 meters in length. during a 3,000 - meter race, runners must complete 15 laps…
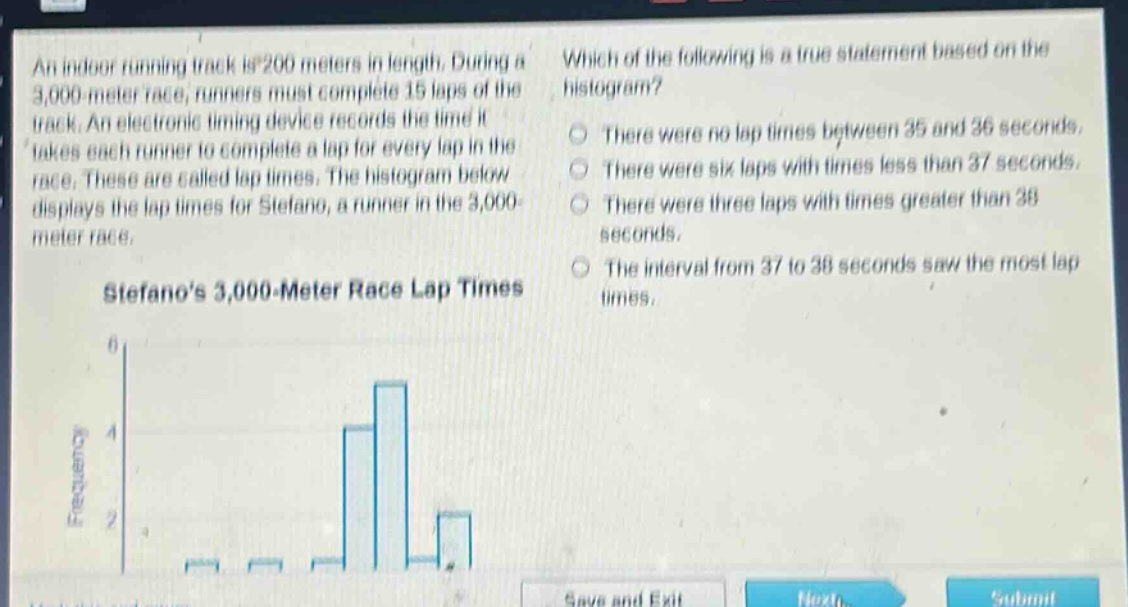
an indoor running track is 200 meters in length. during a 3,000 - meter race, runners must complete 15 laps of the track. an electronic timing device records the time it takes each runner to complete a lap for every lap in the race. these are called lap times. the histogram below displays the lap times for stefano, a runner in the 3,000 - meter race. stefanos 3,000 - meter race lap times which of the following is a true statement based on the histogram? there were no lap times between 35 and 36 seconds. there were six laps with times less than 37 seconds. there were three laps with times greater than 38 seconds. the interval from 37 to 38 seconds saw the most lap times.
Answer
Explanation:
Step1: Analyze option 1
Check if there are no lap - times between 35 and 36 seconds. From the histogram, we can see if the bar for the 35 - 36 interval has a height of 0.
Step2: Analyze option 2
Sum the frequencies of the intervals less than 37 seconds. The intervals less than 37 seconds are the first two non - zero intervals. Add their frequencies.
Step3: Analyze option 3
Sum the frequencies of the intervals greater than 38 seconds. Check the height of the bar for the interval greater than 38 seconds.
Step4: Analyze option 4
Find the interval with the highest frequency. Compare the heights of all the bars in the histogram.
From the histogram:
- Option 1: There are no lap times between 35 and 36 seconds as the frequency for that interval is 0.
- Option 2: The sum of frequencies of intervals less than 37 seconds is not 6.
- Option 3: The number of laps with times greater than 38 seconds is not 3.
- Option 4: The interval from 37 to 38 seconds does not have the most lap times.
Answer:
There were no lap times between 35 and 36 seconds.