an internet and cable - television supplier surveyed a random sample of their customers. the results are…
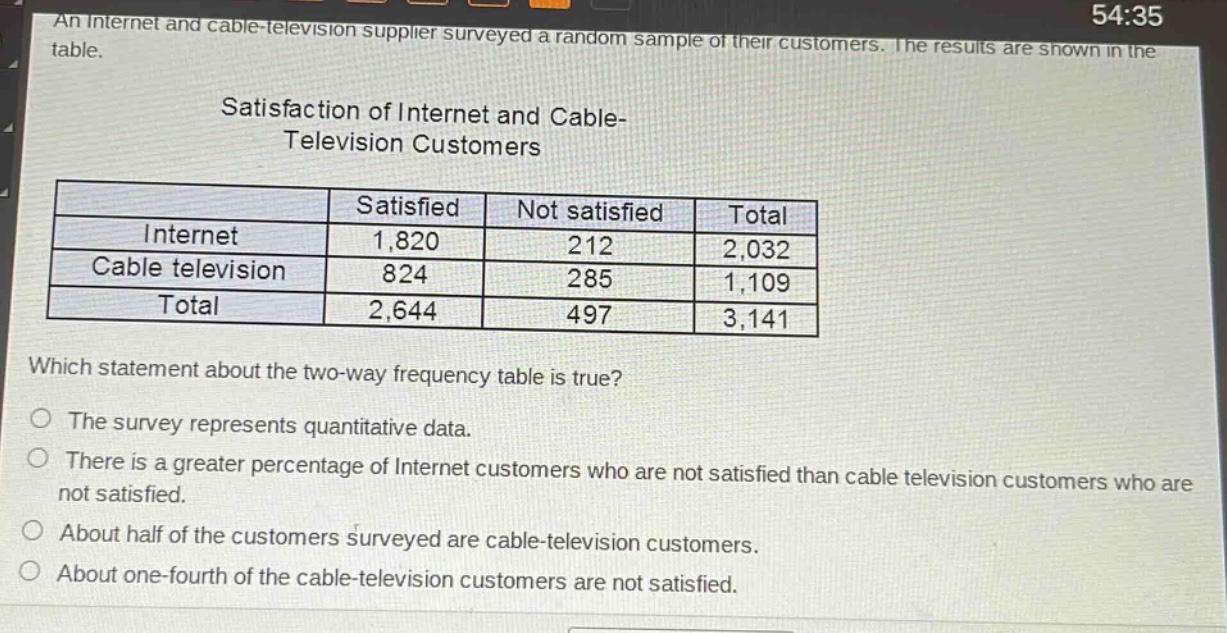
an internet and cable - television supplier surveyed a random sample of their customers. the results are shown in the table.\nsatisfaction of internet and cable - television customers\n| | satisfied | not satisfied | total |\n|--|--|--|--|\n| internet | 1,820 | 212 | 2,032 |\n| cable television | 824 | 285 | 1,109 |\n| total | 2,644 | 497 | 3,141 |\nwhich statement about the two - way frequency table is true?\no the survey represents quantitative data.\no there is a greater percentage of internet customers who are not satisfied than cable television customers who are not satisfied.\no about half of the customers surveyed are cable - television customers.\no about one - fourth of the cable - television customers are not satisfied.
Answer
Explanation:
Step1: Analyze data type
The data is about customer satisfaction (satisfied or not - satisfied), which is categorical, not quantitative. So the first statement is false.
Step2: Calculate percentage of not - satisfied customers
Percentage of not - satisfied Internet customers: $\frac{212}{2032}\times100%\approx10.43%$. Percentage of not - satisfied cable - television customers: $\frac{285}{1109}\times100%\approx25.70%$. So the second statement is false.
Step3: Calculate proportion of cable - television customers
Proportion of cable - television customers: $\frac{1109}{3141}\approx0.353$, not about half. So the third statement is false.
Step4: Calculate proportion of not - satisfied cable - television customers
Proportion of not - satisfied cable - television customers: $\frac{285}{1109}\approx0.257\approx\frac{1}{4}$. So the fourth statement is true.