interpreting a histogram\nthe histogram shows the longest verified wait times for rides at a theme park this…
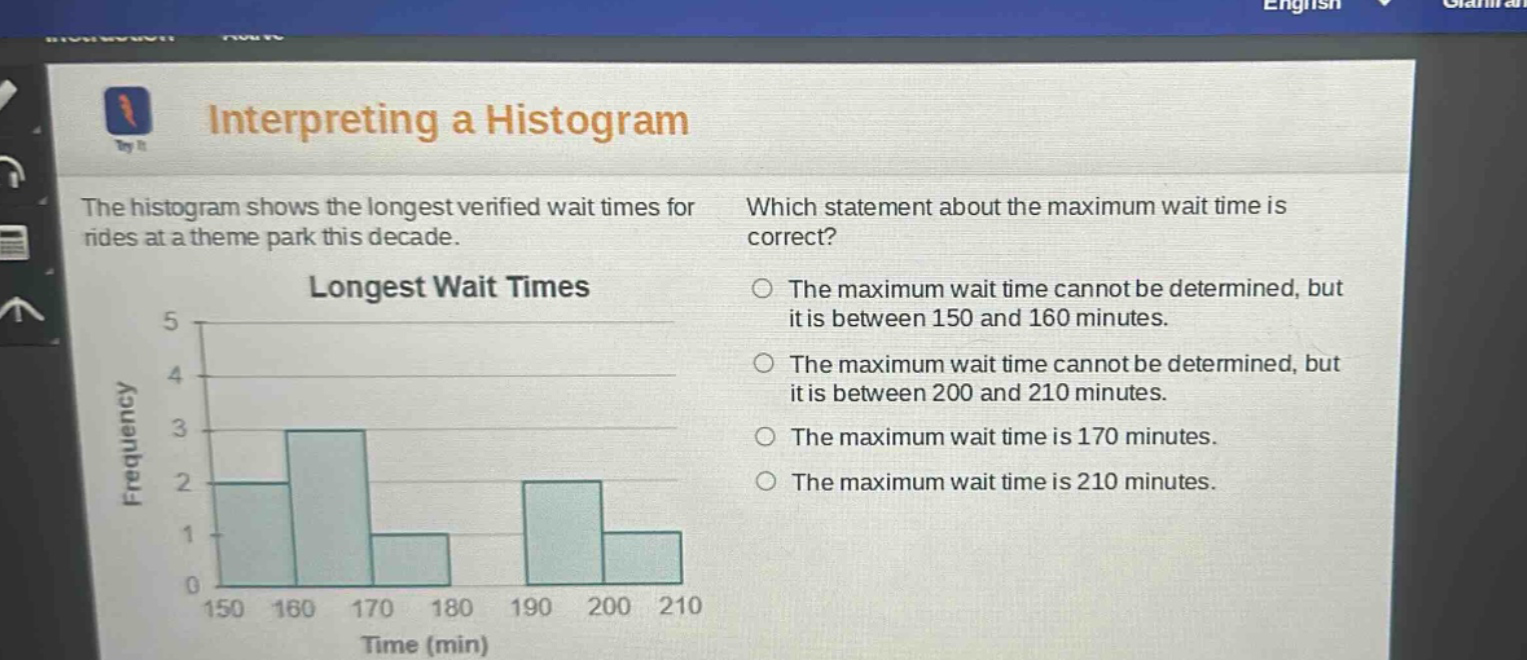
interpreting a histogram\nthe histogram shows the longest verified wait times for rides at a theme park this decade.\nlongest wait times\nwhich statement about the maximum wait time is correct?\nthe maximum wait time cannot be determined, but it is between 150 and 160 minutes.\nthe maximum wait time cannot be determined, but it is between 200 and 210 minutes.\nthe maximum wait time is 170 minutes.\nthe maximum wait time is 210 minutes.
Answer
Explanation:
Step1: Understand histogram data
A histogram shows frequency in intervals. We only know ranges.
Step2: Analyze maximum wait - time
The last interval is 200 - 210 minutes. We can't know exact max within it.
Answer:
The maximum wait time cannot be determined, but it is between 200 and 210 minutes.