interpreting a relative frequency table\nstudents in 7th and 8th grade were asked the types of movies they…
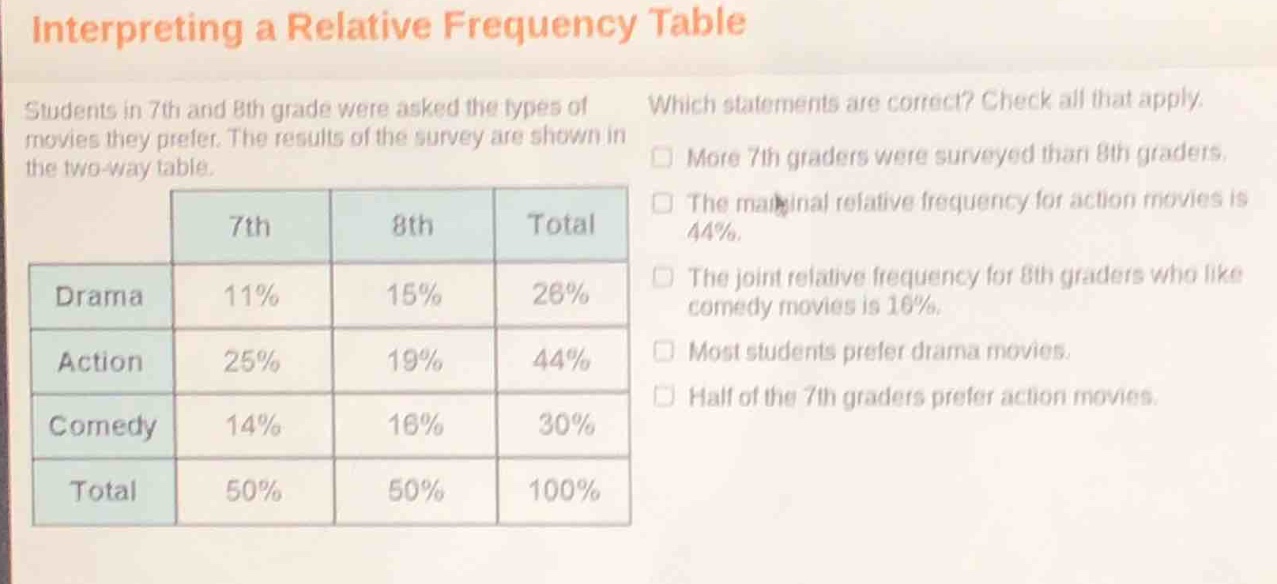
interpreting a relative frequency table\nstudents in 7th and 8th grade were asked the types of movies they prefer. the results of the survey are shown in the two - way table.\nwhich statements are correct? check all that apply.\nmore 7th graders were surveyed than 8th graders.\nthe marginal relative frequency for action movies is 44%.\nthe joint relative frequency for 8th graders who like comedy movies is 16%.\nmost students prefer drama movies.\nhalf of the 7th graders prefer action movies.\n| | 7th | 8th | total |\n|--|--|--|--| \n| drama | 11% | 15% | 26% |\n| action | 25% | 19% | 44% |\n| comedy | 14% | 16% | 30% |\n| total | 50% | 50% | 100% |
Answer
Explanation:
Step1: Analyze number of students surveyed
The total relative - frequency for 7th graders is 50% and for 8th graders is 50%. So, the number of 7th and 8th graders surveyed is the same. So, the statement "More 7th graders were surveyed than 8th graders" is incorrect.
Step2: Check marginal relative frequency for action movies
The marginal relative frequency for action movies is the sum of the relative frequencies of 7th and 8th graders who prefer action movies, i.e., 25%+19% = 44%. So, the statement "The marginal relative frequency for action movies is 44%" is correct.
Step3: Check joint relative frequency for 8th - graders who like comedy movies
The joint relative frequency for 8th - graders who like comedy movies is 16% as given in the table. So, the statement "The joint relative frequency for 8th - graders who like comedy movies is 16%" is correct.
Step4: Compare preferences for movie types
The marginal relative frequency for action movies is 44%, for drama movies is 26%, and for comedy movies is 30%. So, most students prefer action movies, not drama movies. So, the statement "Most students prefer drama movies" is incorrect.
Step5: Check preference of 7th - graders for action movies
The relative frequency of 7th - graders who prefer action movies is 25%, not 50%. So, the statement "Half of the 7th - graders prefer action movies" is incorrect.
Answer:
The marginal relative frequency for action movies is 44%. The joint relative frequency for 8th - graders who like comedy movies is 16%.