what is the interquartile range of this data set? enter your answer in the box. stem leaf 2 8 3 4 0 3 3 5 5…
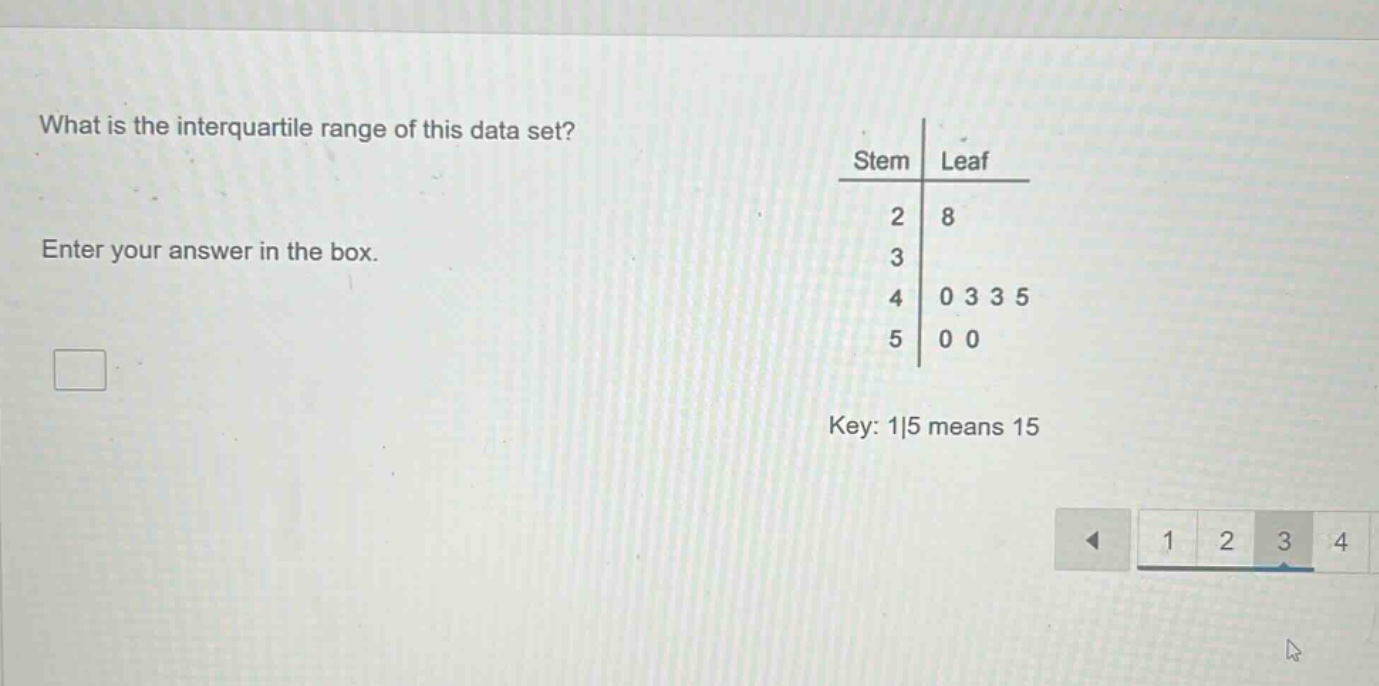
what is the interquartile range of this data set? enter your answer in the box. stem leaf 2 8 3 4 0 3 3 5 5 0 0 key: 1|5 means 15
Answer
Explanation:
Step1: Write out the data - set
The data - set from the stem - and - leaf plot is (28,40,43,43,45,50,50).
Step2: Find the median (Q2)
There are (n = 7) data points. The median is the (\left(\frac{n + 1}{2}\right))-th value. (\frac{7+1}{2}=4) - th value. So, (Q2 = 43).
Step3: Find the lower half and Q1
The lower half of the data set is (28,40,43). There are (n_1=3) data points. The median of the lower half (Q1) is the (\left(\frac{3 + 1}{2}\right))-th value, which is the 2 - nd value. So, (Q1 = 40).
Step4: Find the upper half and Q3
The upper half of the data set is (45,50,50). There are (n_2 = 3) data points. The median of the upper half (Q3) is the (\left(\frac{3+1}{2}\right))-th value, which is the 2 - nd value. So, (Q3 = 50).
Step5: Calculate the inter - quartile range (IQR)
The formula for the inter - quartile range is (IQR=Q3 - Q1). Substitute (Q1 = 40) and (Q3 = 50) into the formula: (IQR=50 - 40=10).
Answer:
10