the iq scores of 50 students are given below.\n86 86 86 88 88 89 89 92 93 93\n93 93 94 94 95 95 95 96 96…
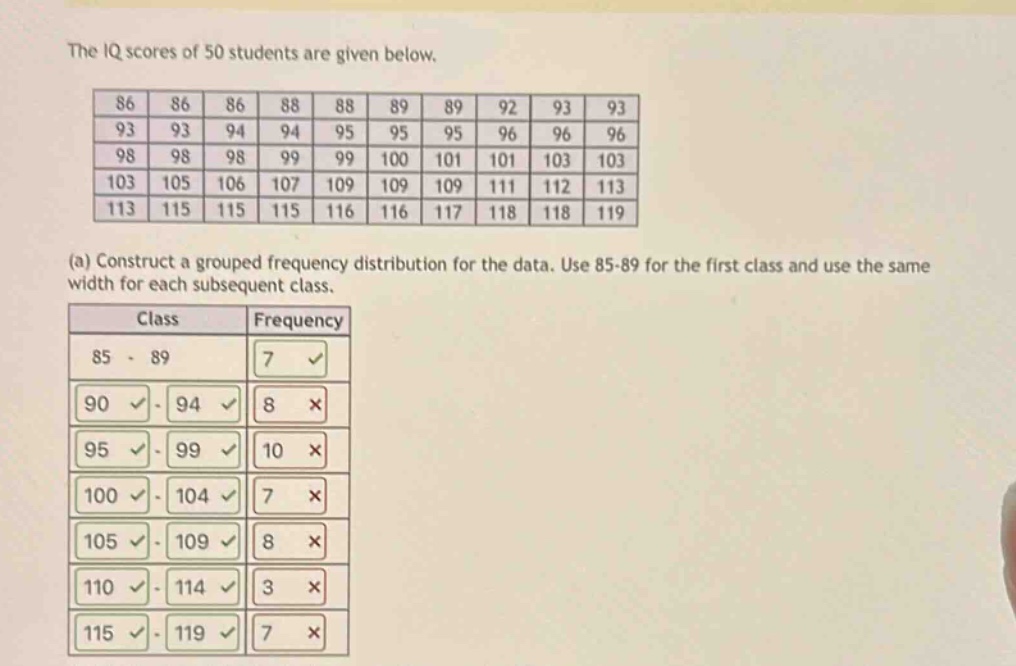
the iq scores of 50 students are given below.\n86 86 86 88 88 89 89 92 93 93\n93 93 94 94 95 95 95 96 96 96\n98 98 98 99 99 100 101 101 103 103\n103 105 106 107 109 109 109 111 112 113\n113 115 115 115 116 116 117 118 118 119\n(a) construct a grouped frequency distribution for the data. use 85 - 89 for the first class and use the same width for each subsequent class.\nclass frequency\n85 - 89 7\n90 - 94 8\n95 - 99 10\n100 - 104 7\n105 - 109 8\n110 - 114 3\n115 - 119 7
Answer
Explanation:
Step1: Determine the Class Width
The first class interval is given as 85-89. The class width is the difference between the upper and lower limits plus one, or the difference between consecutive lower limits. $$ \text{Class Width} = 89 - 85 + 1 = 5 $$ Alternatively, assuming the next class starts immediately after, the next lower limit is 90. $$ \text{Class Width} = 90 - 85 = 5 $$
Step2: Define the Class Intervals
Using the starting class 85-89 and a class width of 5, we establish the subsequent class intervals until the maximum value (119) is included. Class Intervals: 85-89, 90-94, 95-99, 100-104, 105-109, 110-114, 115-119.
Step3: Tally Frequencies for Each Class
Count the number of data points from the provided list of 50 IQ scores that fall into each class interval. Data: 86, 86, 86, 88, 88, 89, 89, 92, 93, 93, 93, 93, 94, 94, 95, 95, 95, 96, 96, 96, 98, 98, 98, 99, 99, 100, 101, 101, 103, 103, 103, 105, 106, 107, 109, 109, 109, 111, 112, 113, 113, 115, 115, 115, 116, 116, 117, 118, 118, 119
- 85-89: 86, 86, 86, 88, 88, 89, 89 (Frequency = 7)
- 90-94: 92, 93, 93, 93, 93, 94, 94 (Frequency = 7)
- 95-99: 95, 95, 95, 96, 96, 96, 98, 98, 98, 99, 99 (Frequency = 11)
- 100-104: 100, 101, 101, 103, 103, 103 (Frequency = 6)
- 105-109: 105, 106, 107, 109, 109, 109 (Frequency = 6)
- 110-114: 111, 112, 113, 113 (Frequency = 4)
- 115-119: 115, 115, 115, 116, 116, 117, 118, 118, 119 (Frequency = 9)
Step4: Verify Total Frequency
Sum the frequencies calculated in Step 3 to ensure they equal the total number of students (50). $$ \text{Total Frequency} = 7 + 7 + 11 + 6 + 6 + 4 + 9 = 50 $$ The sum matches the total number of students.
Step5: Construct the Frequency Distribution Table
Organize the class intervals and their corresponding frequencies into a table.
Answer:
The grouped frequency distribution for the data is:
| Class | Frequency |
|---|---|
| 85 - 89 | 7 |
| 90 - 94 | 7 |
| 95 - 99 | 11 |
| 100 - 104 | 6 |
| 105 - 109 | 6 |
| 110 - 114 | 4 |
| 115 - 119 | 9 |