jacob is practicing the 100 meter dash. the data show his times in seconds. 14, 13, 13.5, 16, 14, 15.5, 14.5…
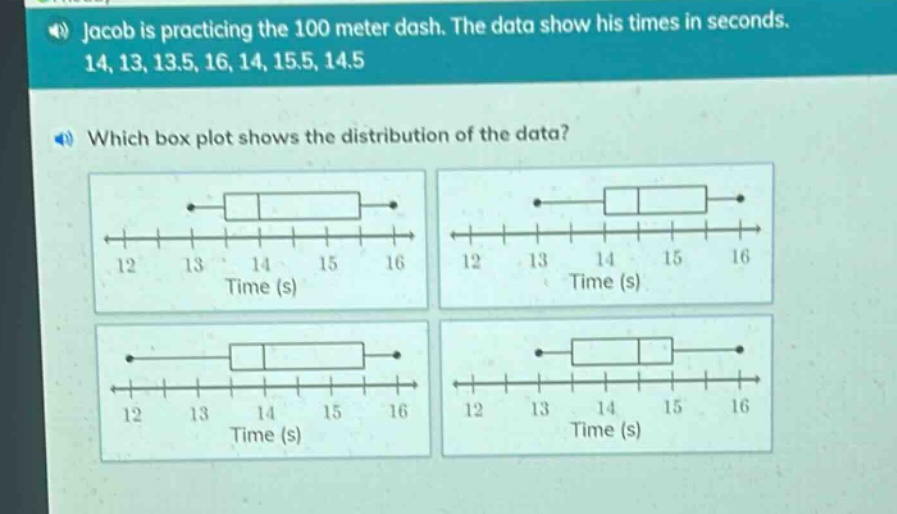
jacob is practicing the 100 meter dash. the data show his times in seconds. 14, 13, 13.5, 16, 14, 15.5, 14.5 which box plot shows the distribution of the data?
Answer
Explanation:
Step1: Arrange data in ascending order
$13, 13.5, 14, 14, 14.5, 15.5, 16$
Step2: Find the median (Q2)
Since there are 7 data - points, the median is the 4th value. So, $Q2 = 14$.
Step3: Find the lower half of data
The lower half is $13, 13.5, 14$. The median of the lower half (Q1) is 13.5.
Step4: Find the upper half of data
The upper half is $14.5, 15.5, 16$. The median of the upper half (Q3) is 15.5.
Step5: Identify the minimum and maximum
The minimum value is 13 and the maximum value is 16.
The box - plot should have the minimum at 13, Q1 at 13.5, Q2 at 14, Q3 at 15.5, and the maximum at 16.
Answer:
The box - plot that has the left - most point at 13, the left edge of the box at 13.5, the line inside the box at 14, the right edge of the box at 15.5, and the right - most point at 16. (Since no specific labels for the box - plots are given, you would need to visually identify the one that matches these values among the options provided in the image).