jake watched a stock car race with his dad. after the race, the television showed the average speed of each…
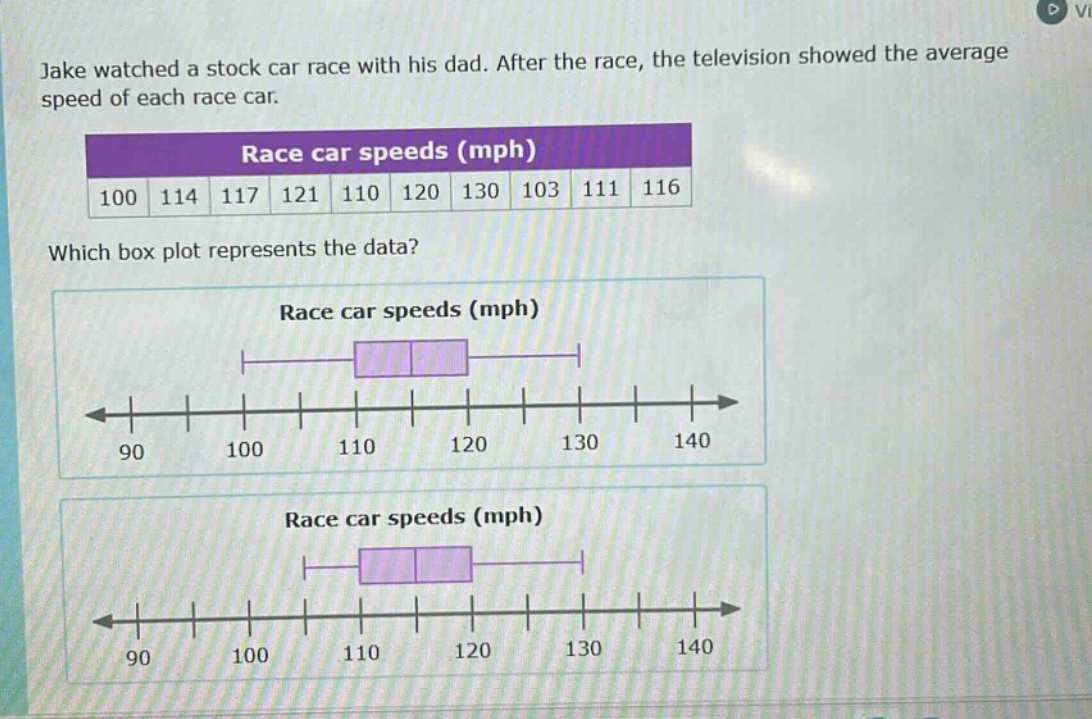
jake watched a stock car race with his dad. after the race, the television showed the average speed of each race car. race car speeds (mph) 100 114 117 121 110 120 130 103 111 116 which box plot represents the data? race car speeds (mph) race car speeds (mph)
Answer
Explanation:
Step1: Arrange data in ascending order
100, 103, 110, 111, 114, 116, 117, 120, 121, 130
Step2: Find the median (Q2)
Since there are 10 data - points, the median is the average of the 5th and 6th ordered values. $\text{Q2}=\frac{114 + 116}{2}=115$
Step3: Find the lower half of data
100, 103, 110, 111, 114. The median of the lower half (Q1) is 110.
Step4: Find the upper half of data
116, 117, 120, 121, 130. The median of the upper half (Q3) is 120.
Step5: Identify the minimum and maximum
The minimum value is 100 and the maximum value is 130.
The box - plot should have the minimum at 100, Q1 at 110, Q2 at 115, Q3 at 120 and the maximum at 130.
Answer:
We need to check which box - plot has the minimum at 100, Q1 at 110, Q2 at 115, Q3 at 120 and the maximum at 130 among the given options. Without seeing the full details of the box - plots in the options, we can't give a definite choice, but the correct box - plot should have these values for its key components.