janie asked all of her classmates about the number of pets they have in their household. her findings are…
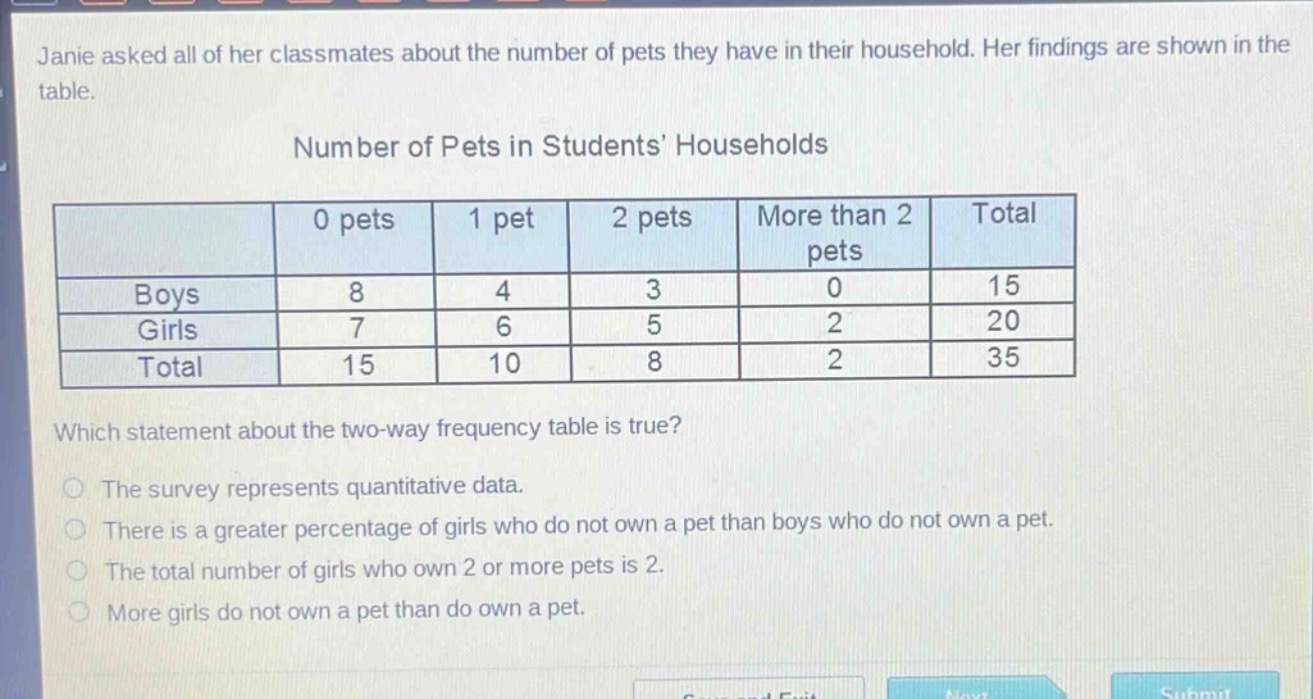
janie asked all of her classmates about the number of pets they have in their household. her findings are shown in the table.\nnumber of pets in students’ households\n| |0 pets|1 pet|2 pets|more than 2 pets|total|\n|--|--|--|--|--|--|\n|boys|8|4|3|0|15|\n|girls|7|6|5|2|20|\n|total|15|10|8|2|35|\nwhich statement about the two - way frequency table is true?\nthe survey represents quantitative data.\nthere is a greater percentage of girls who do not own a pet than boys who do not own a pet.\nthe total number of girls who own 2 or more pets is 2.\nmore girls do not own a pet than do own a pet.
Answer
Explanation:
Step1: Analyze quantitative - data statement
Quantitative data is numerical data that can be measured or counted. The data here is counts of students in different pet - ownership categories, but it's categorical data (by number of pets and gender), not truly quantitative in the sense of being continuous or measurable on a numerical scale. So, the statement "The survey represents quantitative data" is false.
Step2: Calculate percentage of non - pet - owning boys and girls
Percentage of non - pet - owning boys: $\frac{8}{15}\times100%\approx53.3%$. Percentage of non - pet - owning girls: $\frac{7}{20}\times100% = 35%$. So, the statement "There is a greater percentage of girls who do not own a pet than boys who do not own a pet" is false.
Step3: Calculate number of girls with 2 or more pets
Number of girls with 2 or more pets is $5 + 2=7$, not 2. So, the statement "The total number of girls who own 2 or more pets is 2" is false.
Step4: Compare number of pet - owning and non - pet - owning girls
Number of non - pet - owning girls is 7. Number of pet - owning girls is $6 + 5+2=13$. So, the statement "More girls do not own a pet than do own a pet" is false.
Since no option is correct based on the above analysis, there might be an error in the problem - setup or options. But if we assume we have to choose the best - fitting one among the given options, we re - evaluate:
Step5: Re - evaluate options
The data in the table is counts (frequencies) of students in different categories. While it's not strictly quantitative in the traditional sense, it's often considered numerical data in the context of statistics. Categorical data with numerical frequencies can be considered a form of quantitative data for basic statistical analysis.