jaron collected data about the number of students participating in different types of after - school…
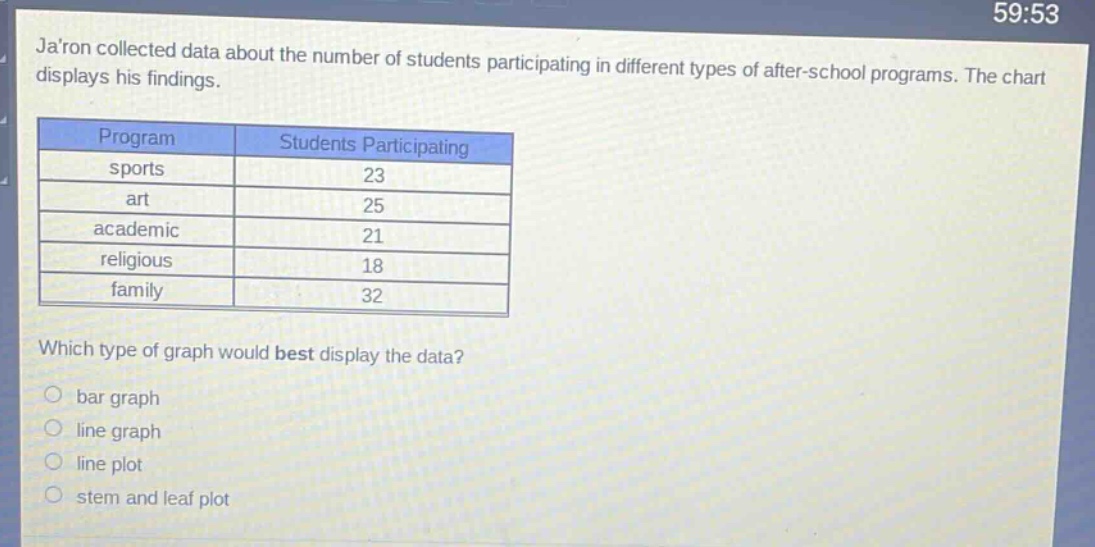
jaron collected data about the number of students participating in different types of after - school programs. the chart displays his findings. which type of graph would best display the data? bar graph line graph line plot stem and leaf plot
Answer
Brief Explanations:
A bar graph is ideal for comparing discrete categories (types of after - school programs) with their corresponding numerical values (number of students). A line graph is for showing trends over a continuous variable (not applicable here). A line plot is used for showing the frequency of data points on a number line. A stem - and - leaf plot is for showing the distribution of numerical data in a condensed form. Since we are comparing different program categories with their student counts, a bar graph is the best choice.
Answer:
bar graph