jayla is the manager of super sandwiches. she recorded the number of sandwiches they sold each day during…
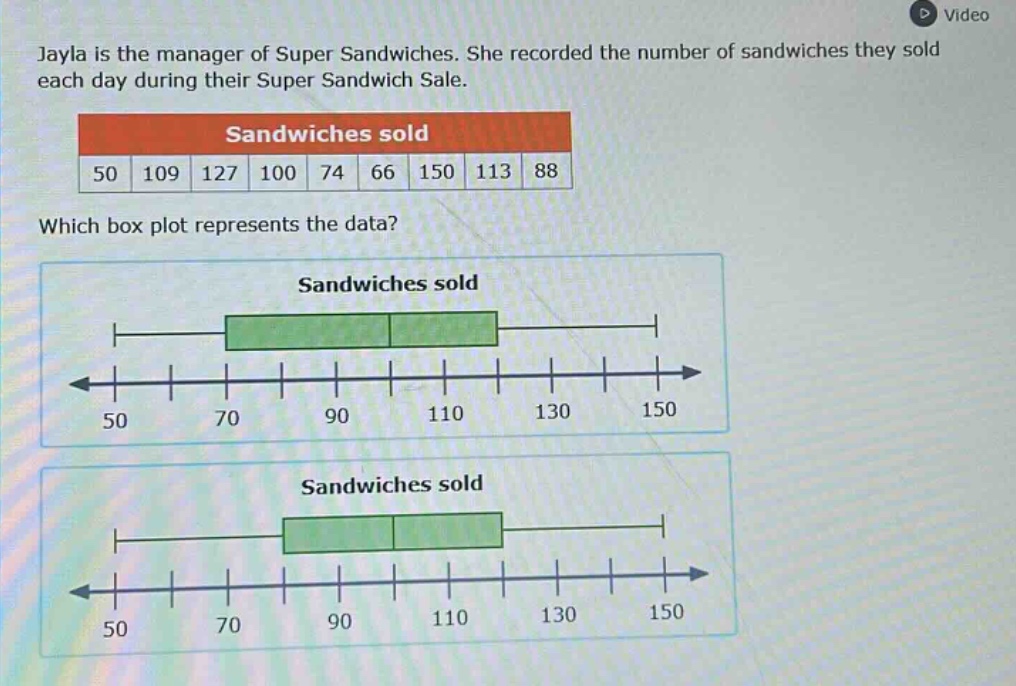
jayla is the manager of super sandwiches. she recorded the number of sandwiches they sold each day during their super sandwich sale.\nsandwiches sold\n50 109 127 100 74 66 150 113 88\nwhich box plot represents the data?\nsandwiches sold\nsandwiches sold
Answer
Explanation:
Step1: Arrange data in ascending order
$50,66,74,88,100,109,113,127,150$
Step2: Find the median (Q2)
There are 9 data - points. The median is the 5th value. So, $Q2 = 100$.
Step3: Find the lower half data
The lower half is $50,66,74,88$. The median of the lower half (Q1) is $\frac{66 + 74}{2}=70$.
Step4: Find the upper half data
The upper half is $109,113,127,150$. The median of the upper half (Q3) is $\frac{113+127}{2} = 120$.
Step5: Identify the minimum and maximum
The minimum value is $50$ and the maximum value is $150$.
Step6: Analyze box - plots
The box - plot should have the minimum at $50$, Q1 at $70$, Q2 at $100$, Q3 at $120$ and the maximum at $150$. The first box - plot has these correct values.
Answer:
The first box - plot.