jillian recorded how much fertilizer she gave her roses and the number of blooms they produced. what is a…
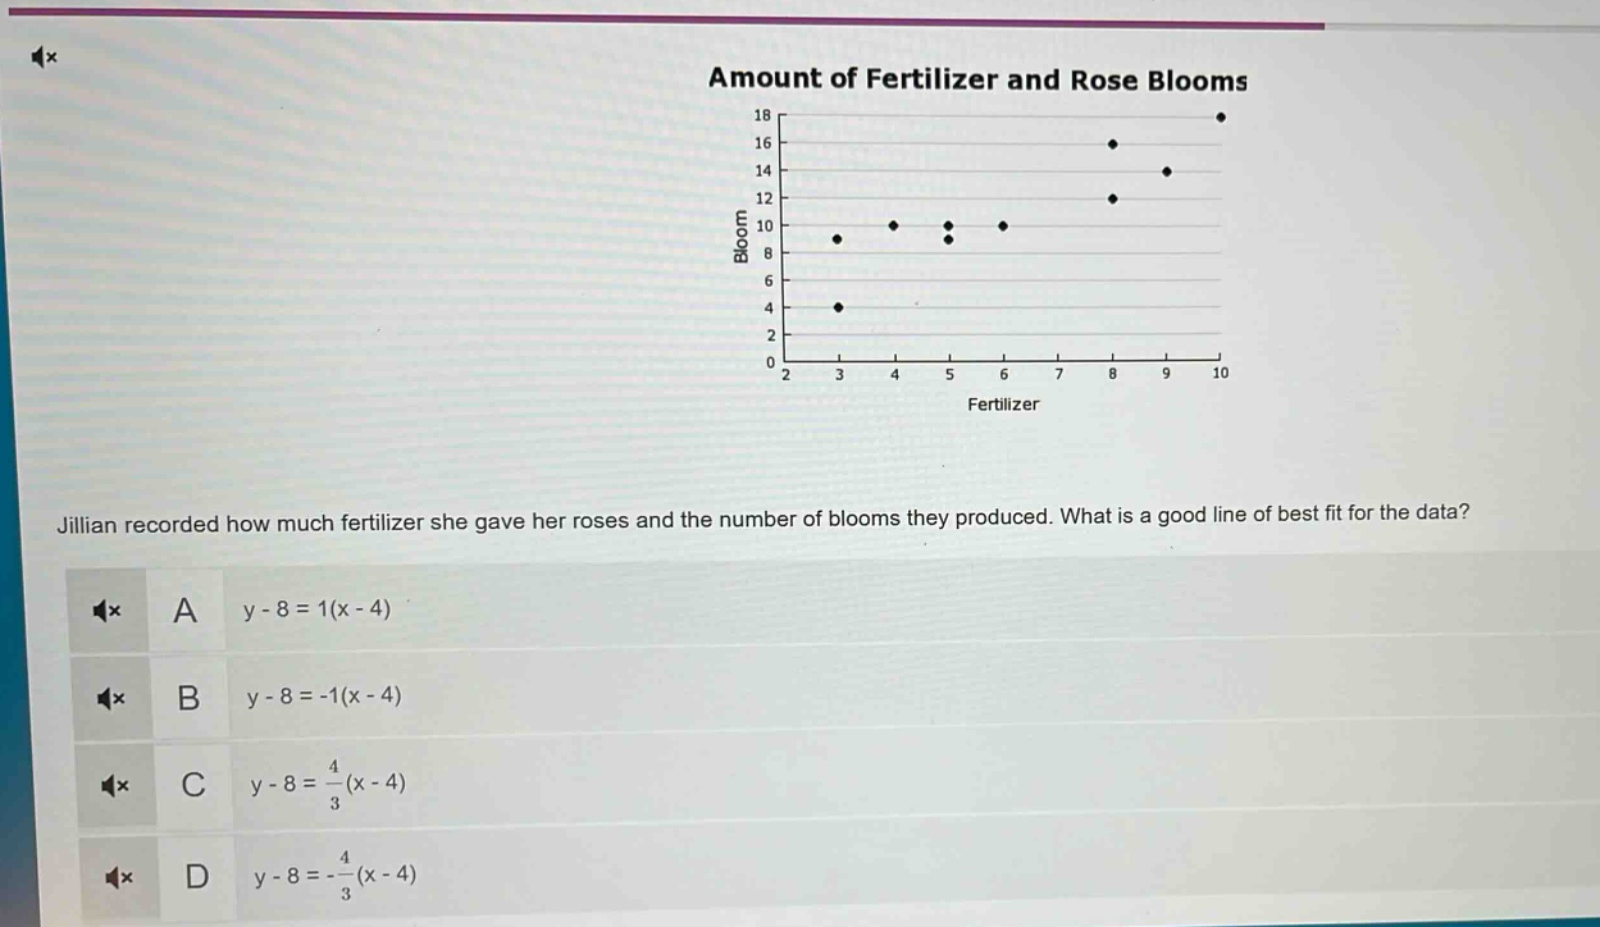
jillian recorded how much fertilizer she gave her roses and the number of blooms they produced. what is a good line of best fit for the data?\na y - 8 = 1(x - 4)\nb y - 8 = -1(x - 4)\nc y - 8 = \\frac{4}{3}(x - 4)\nd y - 8 = -\\frac{4}{3}(x - 4)
Answer
Answer:
A. $y - 8=1(x - 4)$
Explanation:
Step1: Observe data trend
The number of blooms increases as fertilizer amount increases, so slope is positive.
Step2: Analyze point - slope form
The point - slope form is $y - y_1=m(x - x_1)$. Positive slope eliminates B and D.
Step3: Estimate slope visually
The data seems to have a slope close to 1, so A is a good fit.