john sells frozen fruit bars at a stand in a park during the summer months. he records the average weekly…
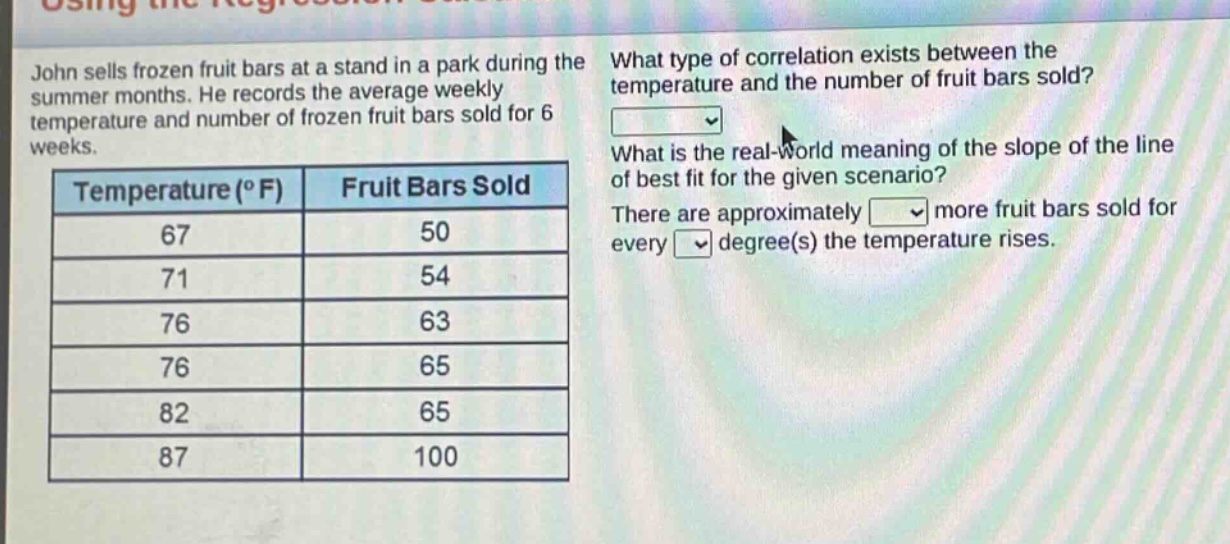
john sells frozen fruit bars at a stand in a park during the summer months. he records the average weekly temperature and number of frozen fruit bars sold for 6 weeks.\n| temperature (°f) | fruit bars sold |\n| ---- | ---- |\n| 67 | 50 |\n| 71 | 54 |\n| 76 | 63 |\n| 76 | 65 |\n| 82 | 65 |\n| 87 | 100 |\nwhat type of correlation exists between the temperature and the number of fruit bars sold?\nwhat is the real - world meaning of the slope of the line of best fit for the given scenario?\nthere are approximately more fruit bars sold for every degree(s) the temperature rises.
Answer
Answer:
- Positive correlation
- There are approximately 2 more fruit bars sold for every 1 degree the temperature rises.
Explanation:
Step1: Analyze correlation type
As temperature increases, number of fruit - bars sold generally increases, so positive correlation.
Step2: Calculate slope approximation
Let $(x_1,y_1)=(67,50)$ and $(x_2,y_2)=(87,100)$. Slope $m=\frac{y_2 - y_1}{x_2 - x_1}=\frac{100 - 50}{87 - 67}=\frac{50}{20}=2.5\approx2$. So for every 1 - degree rise in temperature, approximately 2 more fruit bars are sold.