john sells frozen fruit bars at a stand in a park during the summer months. he records the average weekly…
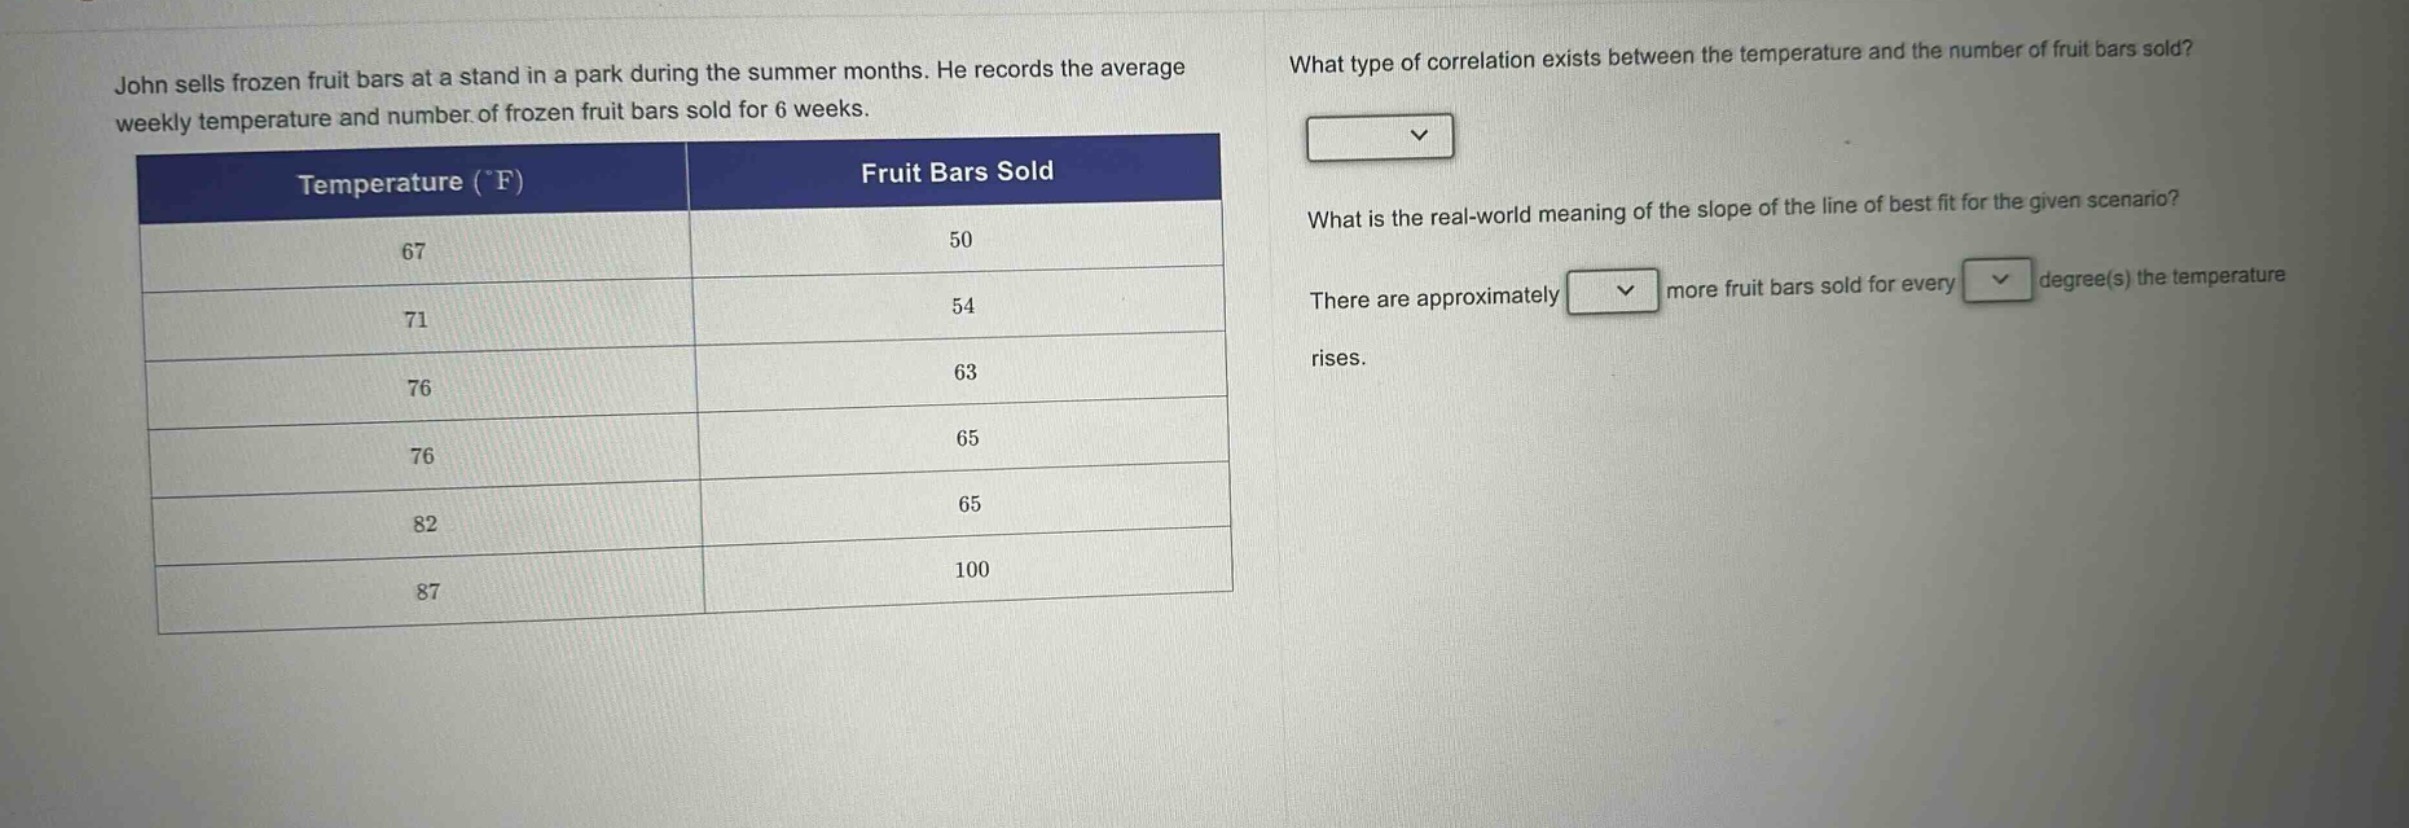
john sells frozen fruit bars at a stand in a park during the summer months. he records the average weekly temperature and number of frozen fruit bars sold for 6 weeks.\n| temperature (°f) | fruit bars sold |\n| ---- | ---- |\n| 67 | 50 |\n| 71 | 54 |\n| 76 | 63 |\n| 76 | 65 |\n| 82 | 65 |\n| 87 | 100 |\nwhat type of correlation exists between the temperature and the number of fruit bars sold?\nwhat is the real - world meaning of the slope of the line of best fit for the given scenario?\nthere are approximately more fruit bars sold for every degree(s) the temperature rises.
Answer
Explanation:
Step1: Observe data trend
As temperature increases from 67°F to 87°F, the number of fruit - bars sold increases from 50 to 100.
Step2: Determine correlation type
Since both variables (temperature and number of fruit - bars sold) increase together, it is a positive correlation.
Step3: Interpret slope meaning
The slope of the line of best fit represents the change in the number of fruit - bars sold for a unit change in temperature. By calculating the change in the number of fruit - bars sold and the change in temperature between data points, we can estimate that for every 1 degree increase in temperature, there are approximately 2 more fruit - bars sold.
Answer:
What type of correlation exists between the temperature and the number of fruit bars sold? Positive correlation What is the real - world meaning of the slope of the line of best fit for the given scenario? There are approximately 2 more fruit bars sold for every 1 degree the temperature rises.