johnny is training for a bike race. he recorded how far he rode in his first few training sessions.\ndistance…
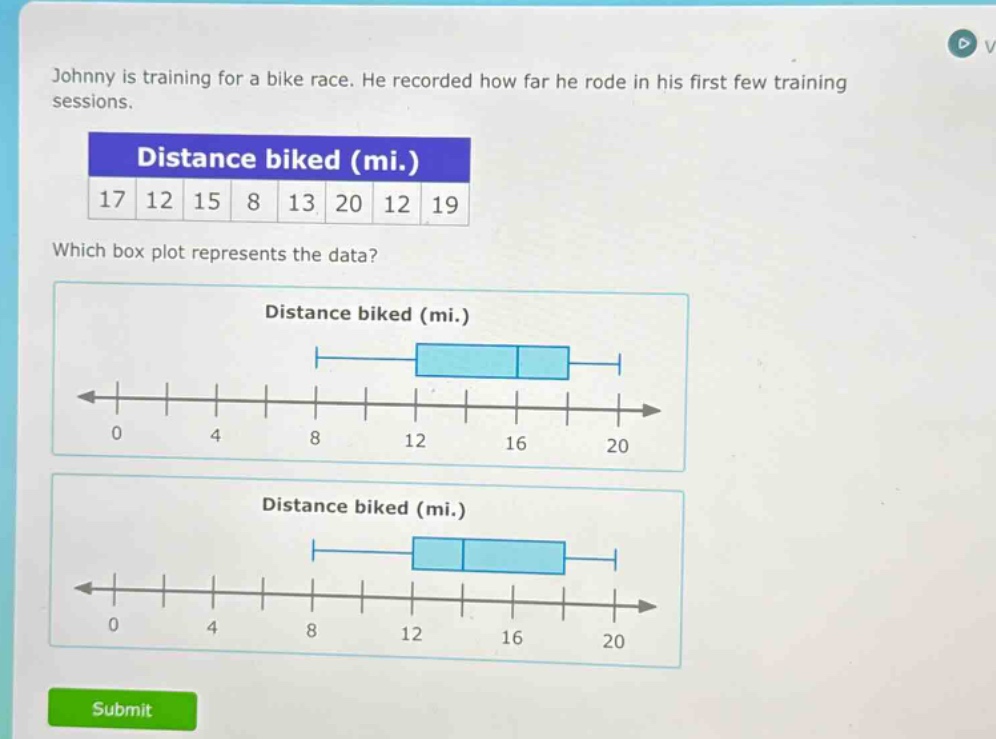
johnny is training for a bike race. he recorded how far he rode in his first few training sessions.\ndistance biked (mi.)\n17 12 15 8 13 20 12 19\nwhich box plot represents the data?\ndistance biked (mi.)\ndistance biked (mi.)
Answer
Explanation:
Step1: Arrange data in ascending order
$8, 12, 12, 13, 15, 17, 19, 20$
Step2: Find the minimum value
The minimum value is $8$.
Step3: Find the first - quartile ($Q_1$)
There are $n = 8$ data points. The position of $Q_1$ is $\frac{n + 1}{4}=\frac{8+1}{4}=2.25$. So, $Q_1=12$.
Step4: Find the median ($Q_2$)
The position of the median is $\frac{n+1}{2}=\frac{8 + 1}{2}=4.5$. So, $Q_2=\frac{13 + 15}{2}=14$.
Step5: Find the third - quartile ($Q_3$)
The position of $Q_3$ is $\frac{3(n + 1)}{4}=\frac{3\times(8 + 1)}{4}=6.75$. So, $Q_3=17$.
Step6: Find the maximum value
The maximum value is $20$.
Step7: Analyze box - plots
The box in a box - plot represents the inter - quartile range ($IQR=Q_3 - Q_1$), with the left - hand side of the box at $Q_1$, the right - hand side at $Q_3$, the line inside the box at the median, the whisker on the left at the minimum value and the whisker on the right at the maximum value. The correct box - plot will have the left side of the box at $12$, the line inside the box around $14$, the right side of the box at $17$, the left whisker starting at $8$ and the right whisker ending at $20$.
Answer:
The box - plot with the left side of the box at $12$, the median line around $14$, the right side of the box at $17$, left whisker starting at $8$ and right whisker ending at $20$ (the first of the two provided box - plots).