johnny is training for a bike race. he recorded how far he rode in his first few training sessions. distance…
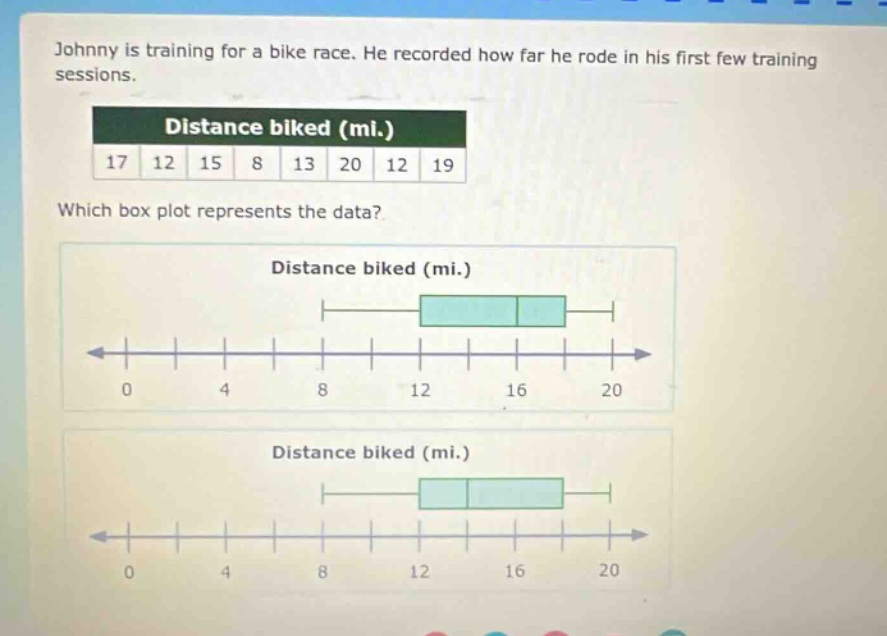
johnny is training for a bike race. he recorded how far he rode in his first few training sessions. distance biked (mi.) 17 12 15 8 13 20 12 19 which box plot represents the data? distance biked (mi.) distance biked (mi.)
Answer
Explanation:
Step1: Arrange data in ascending order
$8, 12, 12, 13, 15, 17, 19, 20$
Step2: Find the median (Q2)
Since there are 8 data - points, the median is the average of the 4th and 5th values. $\frac{13 + 15}{2}=14$.
Step3: Find the lower half and its median (Q1)
The lower half is $8, 12, 12, 13$. The median of the lower half (Q1) is $\frac{12+12}{2} = 12$.
Step4: Find the upper half and its median (Q3)
The upper half is $15, 17, 19, 20$. The median of the upper half (Q3) is $\frac{17 + 19}{2}=18$.
Step5: Identify the minimum and maximum
The minimum value is 8 and the maximum value is 20.
The box - plot should have the minimum at 8, Q1 at 12, Q2 at 14, Q3 at 18, and the maximum at 20.
Answer:
We need to visually check which box - plot has the minimum at 8, Q1 at 12, Q2 at 14, Q3 at 18, and the maximum at 20 among the given options. Without seeing the full options clearly, the steps above give the correct values for constructing the box - plot. If we assume the first box - plot has these correct values based on the scale and positions of the box and whiskers, then that is the correct one. But a full visual inspection of all options is required for a definite answer.