julies volleyball team, the ravens, had a walkathon to raise money for the library. each player counted how…
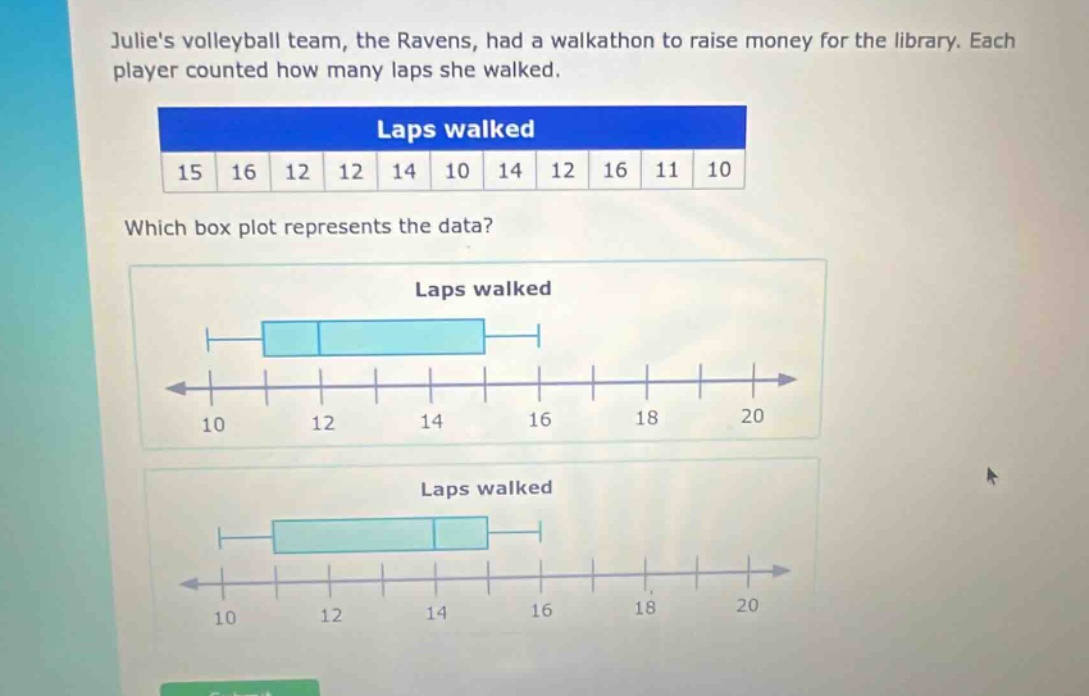
julies volleyball team, the ravens, had a walkathon to raise money for the library. each player counted how many laps she walked. laps walked 15 16 12 12 14 10 14 12 16 11 10 which box plot represents the data? laps walked 10 12 14 16 18 20 laps walked 10 12 14 16 18 20
Answer
Explanation:
Step1: Arrange data in ascending order
10, 10, 11, 12, 12, 12, 14, 14, 15, 16, 16
Step2: Find the minimum value
The minimum value is 10.
Step3: Find the first - quartile ($Q_1$)
There are 11 data points. The position of $Q_1$ is $\frac{11 + 1}{4}=3$. So $Q_1 = 11$.
Step4: Find the median
The position of the median is $\frac{11+ 1}{2}=6$. So the median is 12.
Step5: Find the third - quartile ($Q_3$)
The position of $Q_3$ is $\frac{3(11 + 1)}{4}=9$. So $Q_3 = 15$.
Step6: Find the maximum value
The maximum value is 16.
Step7: Analyze box - plots
In a box - plot, the left - most whisker represents the minimum value, the left side of the box represents $Q_1$, the line inside the box represents the median, the right side of the box represents $Q_3$, and the right - most whisker represents the maximum value. The first box - plot has minimum = 10, $Q_1\approx11$, median = 12, $Q_3\approx15$, maximum = 16 which matches our calculated values.
Answer:
The first box - plot.