karen took three samples from a population of students to measure their average study time. compute the…
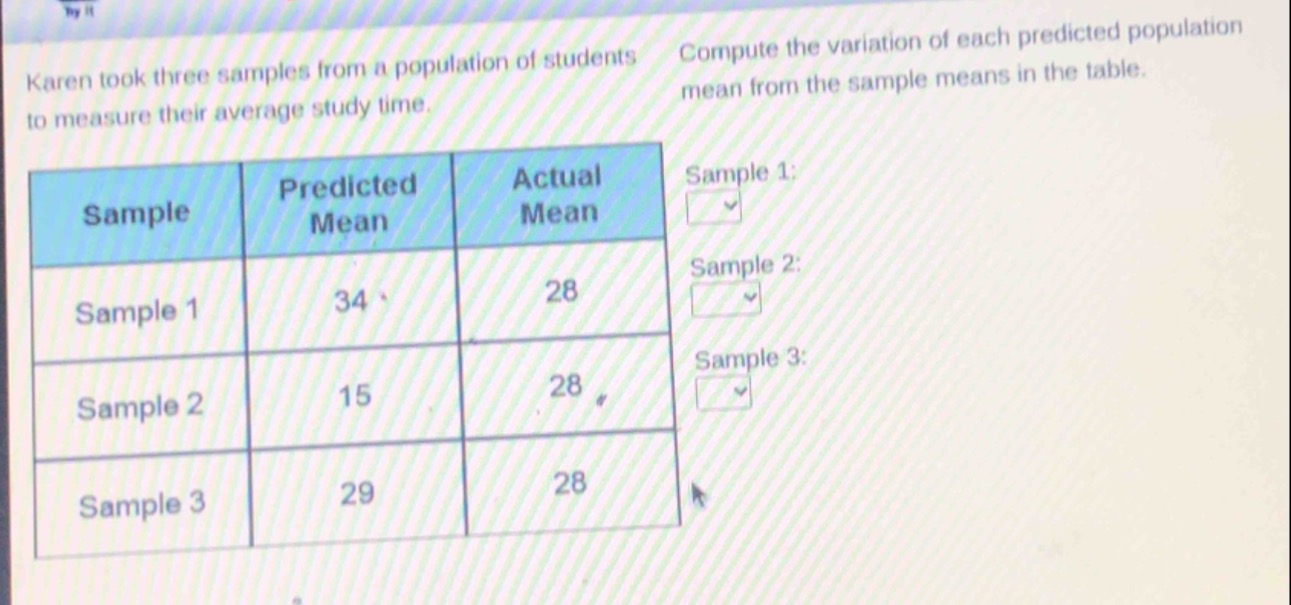
karen took three samples from a population of students to measure their average study time. compute the variation of each predicted population mean from the sample means in the table.\n| sample | predicted mean | actual mean |\n| ---- | ---- | ---- |\n| sample 1 | 34 | 28 |\n| sample 2 | 15 | 28 |\n| sample 3 | 29 | 28 |\nsample 1:\nsample 2:\nsample 3:
Answer
Explanation:
Step1: Calculate variation for Sample 1
Variation is the difference between predicted and actual mean. For Sample 1, it is $34 - 28=6$.
Step2: Calculate variation for Sample 2
For Sample 2, the variation is $|15 - 28| = 13$.
Step3: Calculate variation for Sample 3
For Sample 3, the variation is $29 - 28 = 1$.
Answer:
Sample 1: 6 Sample 2: 13 Sample 3: 1