keilantras math teacher plots student grades on their weekly quizzes against the number of hours they say…
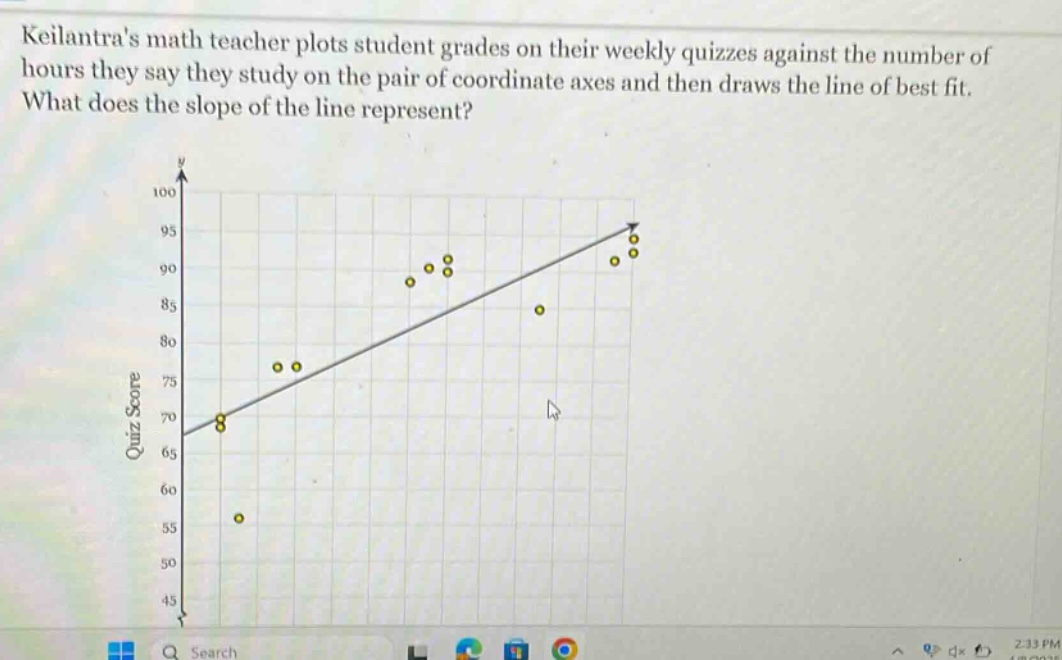
keilantras math teacher plots student grades on their weekly quizzes against the number of hours they say they study on the pair of coordinate axes and then draws the line of best fit. what does the slope of the line represent?
Answer
Brief Explanations:
The line of best - fit in a scatter - plot of quiz scores (y - variable) against study hours (x - variable) represents the trend. The slope of a line in a linear relationship $y=mx + b$ is the rate of change of y with respect to x. Here, y is the quiz score and x is the number of study hours. So, the slope represents the change in quiz score for every one - unit increase in the number of study hours.
Answer:
The change in quiz score for each additional hour of study.