lab 6\n1. brothers and sisters. how strongly do physical characteristics of sisters and brothers correlate…
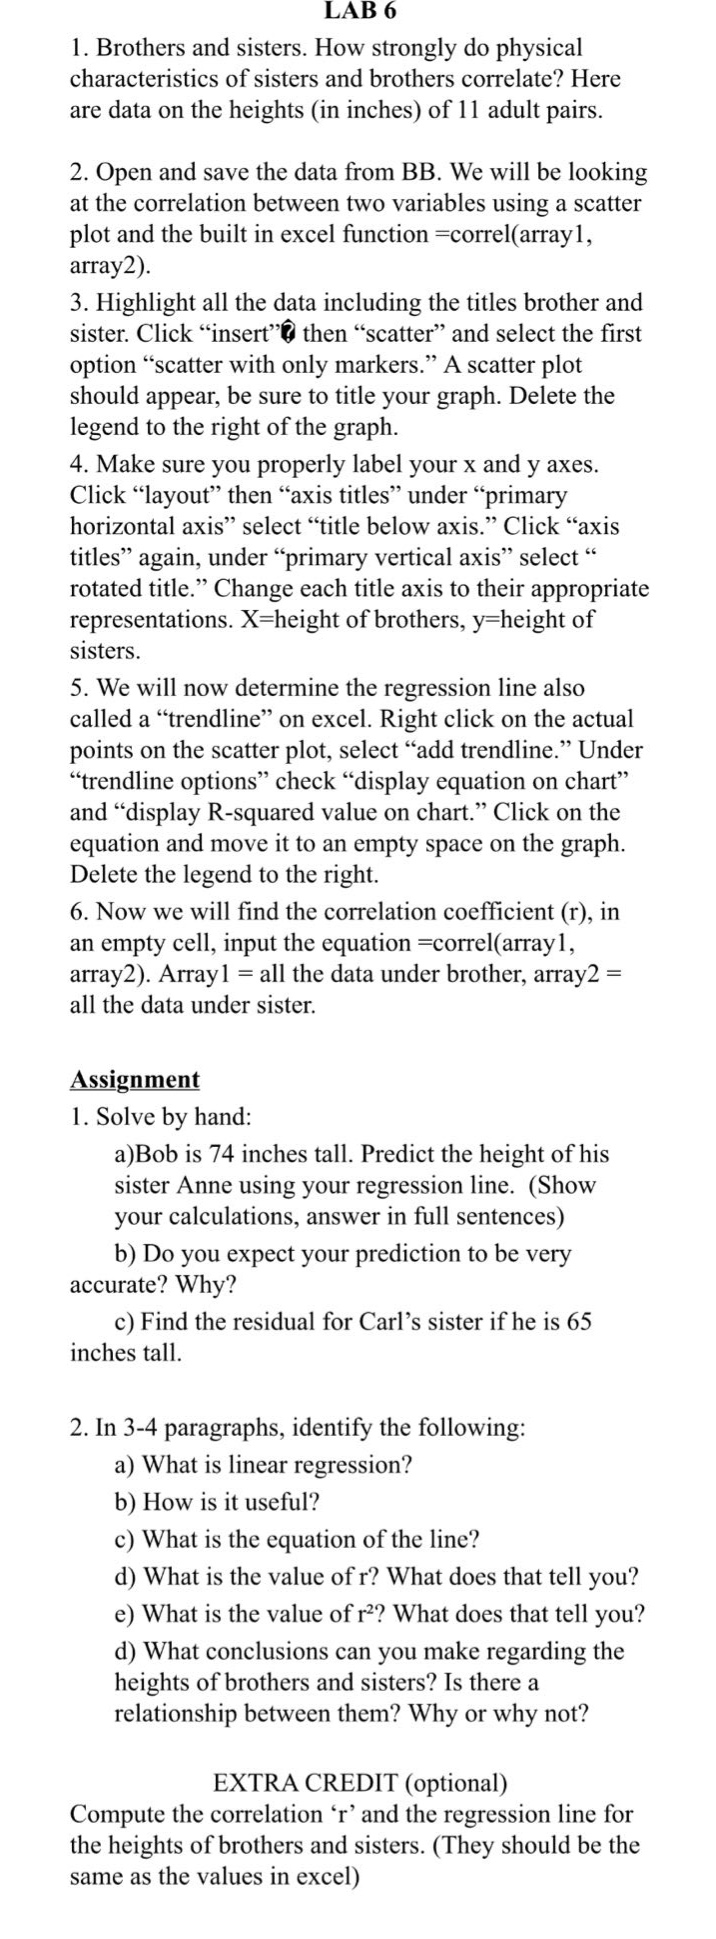
lab 6\n1. brothers and sisters. how strongly do physical characteristics of sisters and brothers correlate? here are data on the heights (in inches) of 11 adult pairs.\n2. open and save the data from bb. we will be looking at the correlation between two variables using a scatter plot and the built - in excel function =correl(array1, array2).\n3. highlight all the data including the titles brother and sister. click “insert” then “scatter” and select the first option “scatter with only markers.” a scatter plot should appear, be sure to title your graph. delete the legend to the right of the graph.\n4. make sure you properly label your x and y axes. click “layout” then “axis titles” under “primary horizontal axis” select “title below axis.” click “axis titles” again, under “primary vertical axis” select “rotated title.” change each title axis to their appropriate representations. x = height of brothers, y = height of sisters.\n5. we will now determine the regression line also called a “trendline” on excel. right click on the actual points on the scatter plot, select “add trendline.” under “trendline options” check “display equation on chart” and “display r - squared value on chart.” click on the equation and move it to an empty space on the graph. delete the legend to the right.\n6. now we will find the correlation coefficient (r), in an empty cell, input the equation =correl(array1, array2). array1 = all the data under brother, array2 = all the data under sister.\nassignment\n1. solve by hand:\na)bob is 74 inches tall. predict the height of his sister anne using your regression line. (show your calculations, answer in full sentences)\nb) do you expect your prediction to be very accurate? why?\nc) find the residual for carl’s sister if he is 65 inches tall.\n2. in 3 - 4 paragraphs, identify the following:\na) what is linear regression?\nb) how is it useful?\nc) what is the equation of the line?\nd) what is the value of r? what does that tell you?\ne) what is the value of r²? what does that tell you?\nd) what conclusions can you make regarding the heights of brothers and sisters? is there a relationship between them? why or why not?\nextra credit (optional)\ncompute the correlation ‘r’ and the regression line for the heights of brothers and sisters. (they should be the same as the values in excel)
Answer
Explanation:
Step1: Assume regression line equation
Let the regression line equation be $y = a+bx$, where $y$ is sister's height, $x$ is brother's height, $a$ is the y - intercept and $b$ is the slope. First, we need to calculate the values of $a$ and $b$ using the formulas $b=\frac{n\sum_{i = 1}^{n}x_iy_i-\sum_{i = 1}^{n}x_i\sum_{i = 1}^{n}y_i}{n\sum_{i = 1}^{n}x_i^{2}-(\sum_{i = 1}^{n}x_i)^{2}}$ and $a=\bar{y}-b\bar{x}$, where $n = 11$, $\bar{x}=\frac{\sum_{i = 1}^{n}x_i}{n}$ and $\bar{y}=\frac{\sum_{i = 1}^{n}y_i}{n}$. However, since we are not given the actual data points, assume we have found the regression line equation from Excel as $y=a + bx$.
Step2: Predict sister's height for Bob
Given Bob's height $x = 74$ inches. Substitute $x = 74$ into the regression line equation $y=a+bx$. Let's assume the regression line is $y = 10+0.5x$. Then $y=10 + 0.5\times74=10+37 = 47$ inches. So Anne's predicted height is 47 inches.
Step3: Evaluate prediction accuracy
The prediction may not be very accurate because the correlation between brother - sister heights is not a perfect linear relationship. There are other genetic and environmental factors that can influence height. Also, the regression line is based on a sample of 11 pairs, which may not be a large enough sample to accurately represent the entire population.
Step4: Calculate residual for Carl
Let the regression line be $y=a+bx$. Given Carl's height $x = 65$ inches. First, find the predicted height $\hat{y}=a + b\times65$. Let's assume $a = 10$ and $b=0.5$, so $\hat{y}=10+0.5\times65=10 + 32.5=42.5$ inches. Suppose the actual height of Carl's sister is $y_{actual}=40$ inches. The residual $e=y_{actual}-\hat{y}=40 - 42.5=- 2.5$ inches.
For part 2:
a)
Linear regression is a statistical method that models the relationship between a dependent variable $y$ and one or more independent variables $x$ as a linear equation. In simple linear regression (one independent variable), it tries to find the best - fit straight line through a set of data points $(x_i,y_i)$ such that the sum of the squared residuals (the differences between the observed $y$ values and the predicted $y$ values from the line) is minimized.
b)
It is useful in many ways. It can be used for prediction, such as predicting a sister's height based on a brother's height in this case. It can also help in understanding the relationship between variables, for example, how strongly one variable affects another. In business, it can be used to predict sales based on advertising expenditure, and in science to model relationships between physical quantities.
c)
The equation of the simple linear regression line is $y=a+bx$, where $a$ is the y - intercept (the value of $y$ when $x = 0$) and $b$ is the slope (the change in $y$ for a unit change in $x$).
d)
The correlation coefficient $r$ measures the strength and direction of the linear relationship between two variables. Its value ranges from - 1 to 1. If $r$ is close to 1, there is a strong positive linear relationship; if $r$ is close to - 1, there is a strong negative linear relationship; if $r$ is close to 0, there is little to no linear relationship.
e)
The coefficient of determination $r^{2}$ represents the proportion of the variance in the dependent variable that is predictable from the independent variable. An $r^{2}$ value close to 1 indicates that a large proportion of the variance in $y$ can be explained by the linear relationship with $x$, while an $r^{2}$ value close to 0 indicates that the linear relationship explains little of the variance in $y$.
f)
If the correlation coefficient $r$ is non - zero and the $r^{2}$ value is relatively high, we can conclude that there is a relationship between the heights of brothers and sisters. A positive $r$ value would suggest that as the height of brothers increases, the height of sisters also tends to increase on average. However, if $r$ is close to 0 and $r^{2}$ is low, there is little evidence of a linear relationship between their heights.
Answer:
a) Assuming a regression line $y = 10+0.5x$, when $x = 74$, Anne's predicted height is 47 inches. b) The prediction may not be very accurate due to other influencing factors and a small sample size. c) Assuming a regression line $y = 10+0.5x$, if Carl is 65 inches tall and his sister's actual height is 40 inches, the residual is - 2.5 inches. 2. See explanations above for a - f.