a large manufacturing company models the number of workers it hired each year after 2010 using the function…
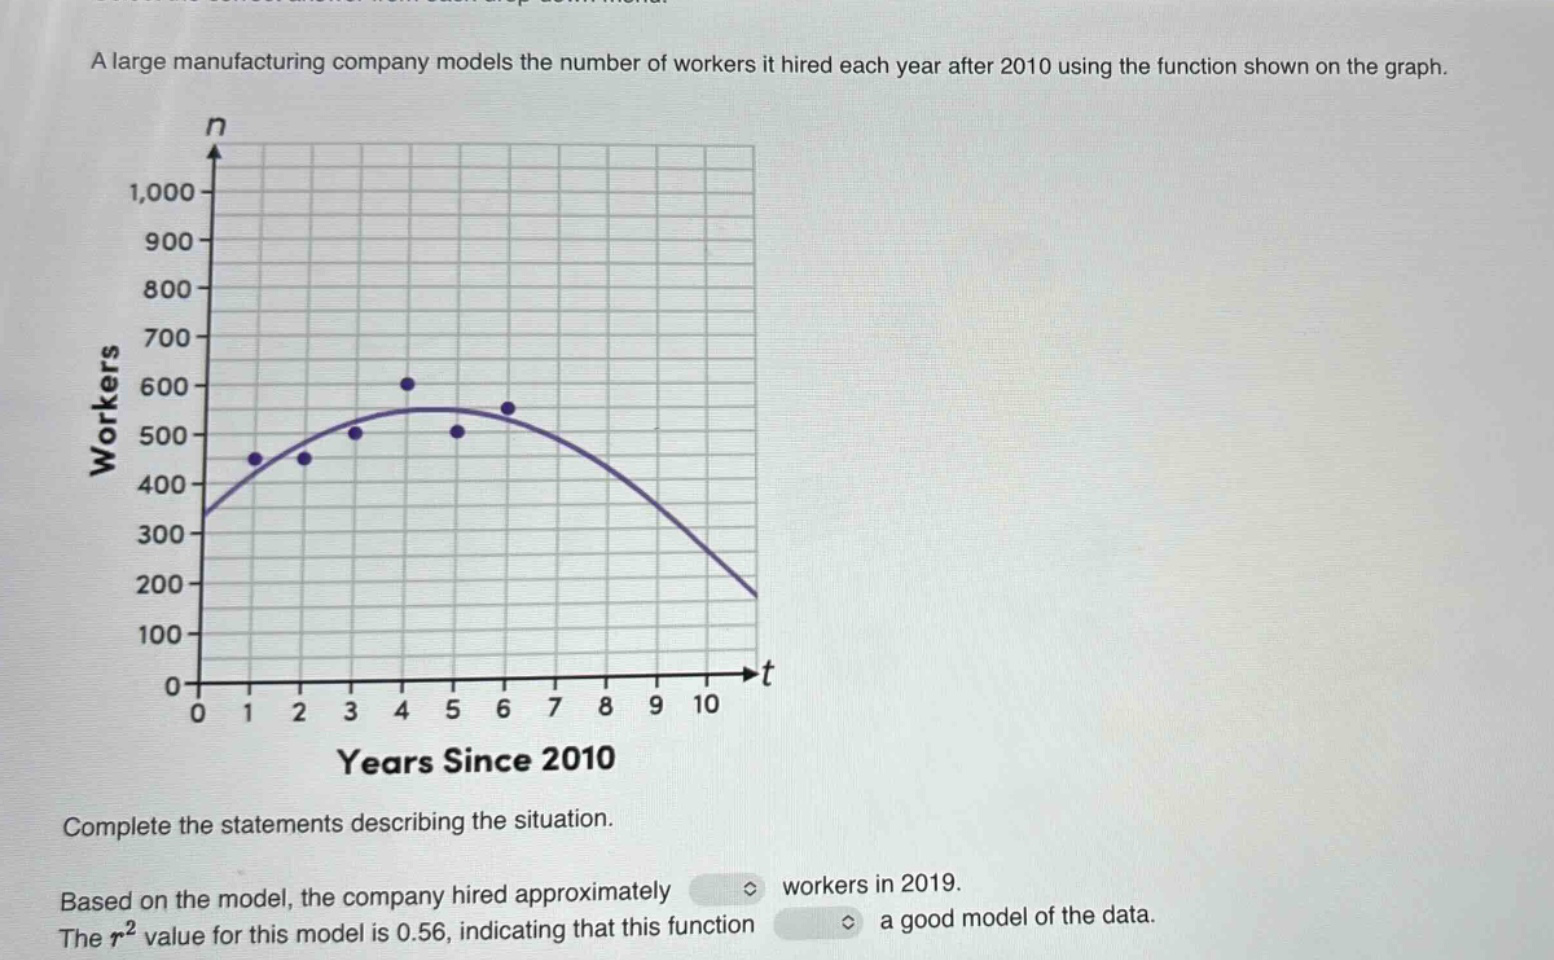
a large manufacturing company models the number of workers it hired each year after 2010 using the function shown on the graph. complete the statements describing the situation. based on the model, the company hired approximately workers in 2019. the $r^{2}$ value for this model is 0.56, indicating that this function a good model of the data.
Answer
Explanation:
Step1: Determine the value of (t) for 2019
Since (t) is years since 2010, for 2019, (t = 2019 - 2010=9).
Step2: Estimate the number of workers from the graph
Looking at the graph at (t = 9), the number of workers (n) is approximately 250.
Step3: Analyze the (r^{2}) value
The coefficient of determination (r^{2}) ranges from 0 to 1. A value close to 1 indicates a good - fit model, while a value far from 1 (close to 0) indicates a poor - fit model. Since (r^{2}=0.56), which is not very close to 1, it is not a very good model of the data.
Answer:
The company hired approximately 250 workers in 2019. The function is not a good model of the data.