last semester, mr. king kept track of how many times each student was absent. student absences what was the…
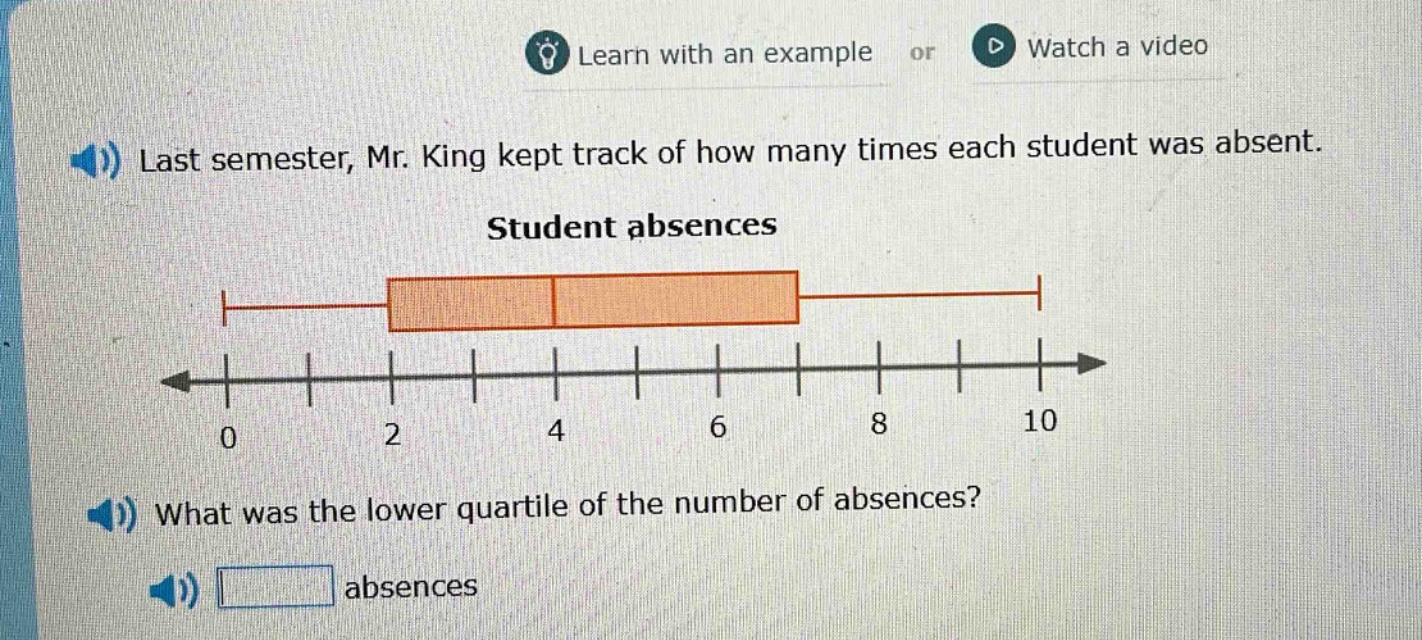
last semester, mr. king kept track of how many times each student was absent. student absences what was the lower quartile of the number of absences? absences
Answer
Explanation:
Step1: Understand quartile concept
The lower - quartile ($Q_1$) is the value that separates the lowest 25% of the data from the rest. For a box - and - whisker plot, the left - hand edge of the box represents the lower quartile.
Step2: Identify value from plot
Looking at the box - and - whisker plot of student absences, the left - hand edge of the box is at 3.
Answer:
3