last week, the bay city bus company tracked how long their school buses took to complete their routes. this…
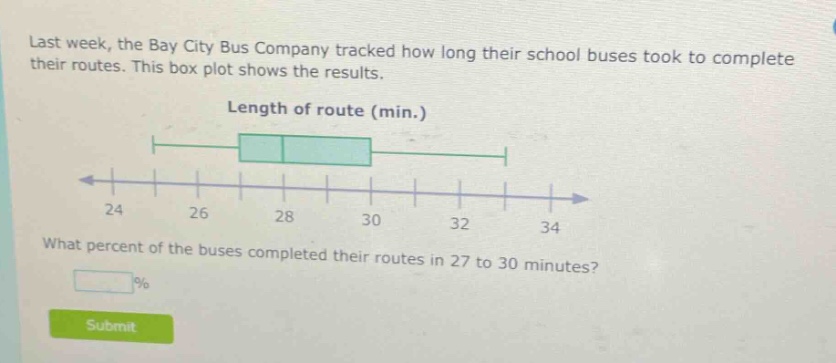
last week, the bay city bus company tracked how long their school buses took to complete their routes. this box plot shows the results. length of route (min.) what percent of the buses completed their routes in 27 to 30 minutes? %
Answer
Answer:
50
Explanation:
Step1: Recall box - plot properties
In a box - plot, the box represents the inter - quartile range (IQR). The lower quartile ($Q_1$) is the value at the start of the box and the upper quartile ($Q_3$) is the value at the end of the box. The median is the line inside the box.
Step2: Identify quartile values
From the box - plot, the lower quartile ($Q_1$) is 27 and the upper quartile ($Q_3$) is 30.
Step3: Calculate the percentage
The inter - quartile range contains 50% of the data. So the percentage of buses that completed their routes in 27 to 30 minutes is 50%.