last year, the government for a state reported the number of new businesses in each of several cities. the…
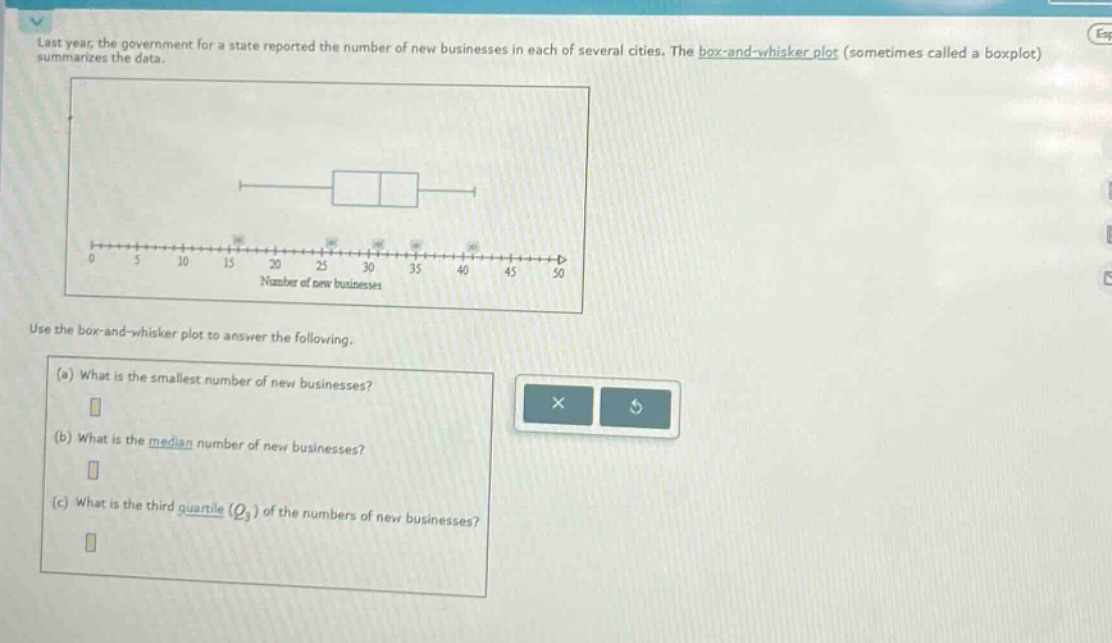
last year, the government for a state reported the number of new businesses in each of several cities. the box - and - whisker plot (sometimes called a boxplot) summarizes the data. use the box - and - whisker plot to answer the following. (a) what is the smallest number of new businesses? (b) what is the median number of new businesses? (c) what is the third quartile (q3) of the numbers of new businesses?
Answer
Explanation:
Step1: Identify smallest value
The left - most end of the whisker represents the smallest value. From the box - and - whisker plot, the smallest number of new businesses is at 5.
Step2: Identify median
The line inside the box represents the median. In the given box - and - whisker plot, the median is at 25.
Step3: Identify third quartile
The right - hand edge of the box represents the third quartile ($Q_3$). From the plot, $Q_3$ is at 35.
Answer:
(a) 5 (b) 25 (c) 35