last year, greg got a new job managing the gift shop at the bern valley zoo. one of his responsibilities was…
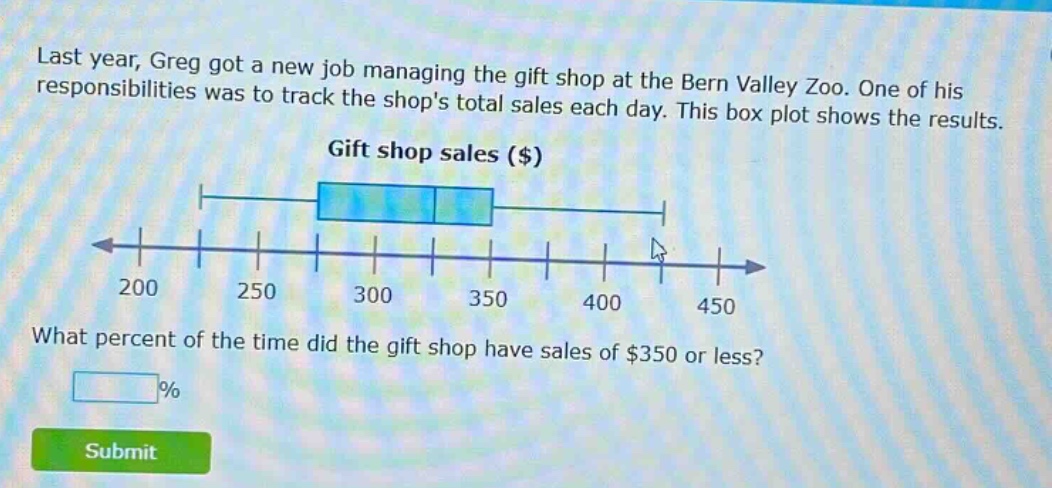
last year, greg got a new job managing the gift shop at the bern valley zoo. one of his responsibilities was to track the shops total sales each day. this box plot shows the results. gift shop sales ($) what percent of the time did the gift shop have sales of $350 or less? % submit
Answer
Explanation:
Step1: Understand box - plot properties
In a box - plot, the box represents the inter - quartile range (IQR). The left edge of the box is the first quartile ($Q_1$), the line inside the box is the median ($Q_2$), and the right edge of the box is the third quartile ($Q_3$). The whiskers extend to the minimum and maximum values within a certain range.
Step2: Identify quartile values
The value of $350$ is the third - quartile ($Q_3$) of the box - plot. By definition, $Q_3$ represents the 75th percentile. This means that 75% of the data values are less than or equal to $Q_3$.
Answer:
75