last year, janelle worked as a party planner. she kept track of the number of guests at each of the parties…
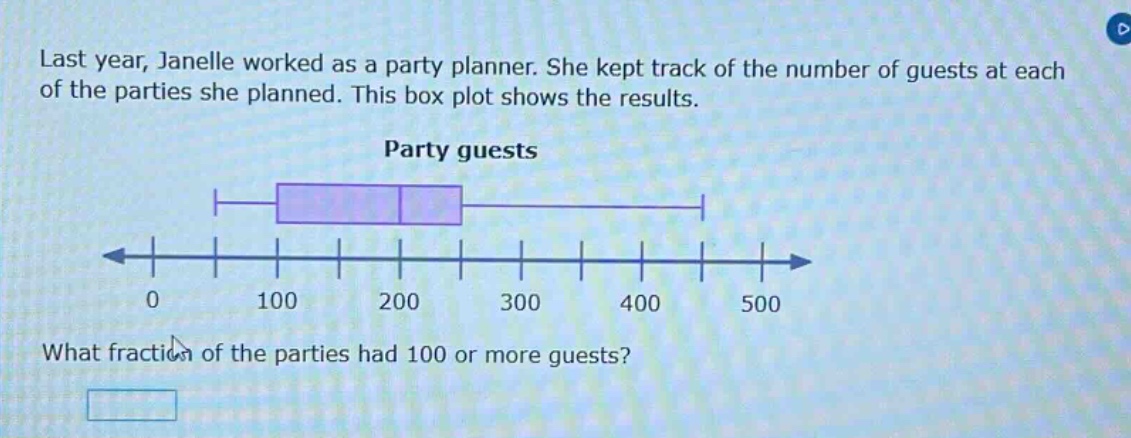
last year, janelle worked as a party planner. she kept track of the number of guests at each of the parties she planned. this box plot shows the results. party guests what fraction of the parties had 100 or more guests?
Answer
Explanation:
Step1: Recall box - plot properties
In a box - plot, the box and whiskers represent different parts of the data distribution. The left - hand side of the box is the first quartile ($Q_1$), the line inside the box is the median ($Q_2$), and the right - hand side of the box is the third quartile ($Q_3$). The whiskers extend to the minimum and maximum values. Here, the value of 100 is the first quartile ($Q_1$).
Step2: Use quartile concept for fraction
Quartiles divide the data into four equal parts. The first quartile ($Q_1$) represents the 25th percentile of the data. So, the fraction of data that is 100 or more (i.e., from $Q_1$ to the maximum) is $\frac{3}{4}$ since $1 - \frac{1}{4}=\frac{3}{4}$.
Answer:
$\frac{3}{4}$