last year, nicholas started babysitting to earn extra spending money. over the summer, he tracked how much…
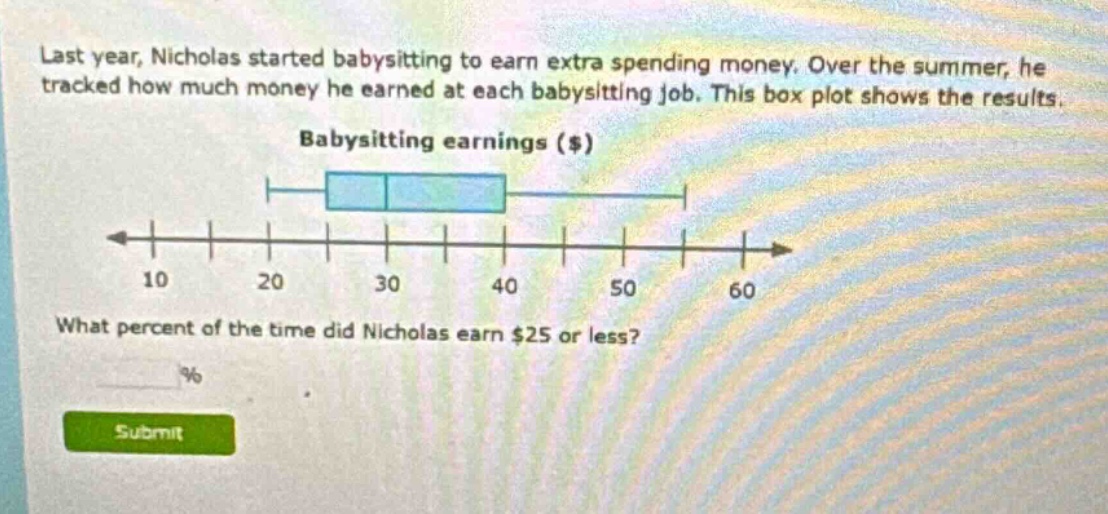
last year, nicholas started babysitting to earn extra spending money. over the summer, he tracked how much money he earned at each babysitting job. this box plot shows the results. babysitting earnings ($) what percent of the time did nicholas earn $25 or less? % submit
Answer
Explanation:
Step1: Understand box - plot quartiles
In a box - plot, the left - most whisker represents the minimum value, the left side of the box represents the first quartile ($Q_1$), the middle line of the box represents the median ($Q_2$), the right side of the box represents the third quartile ($Q_3$), and the right - most whisker represents the maximum value. The first quartile ($Q_1$) marks the 25th percentile, meaning 25% of the data lies below it.
Step2: Locate $25$ on the box - plot
We observe that $25$ is at the first quartile ($Q_1$) of the box - plot.
Answer:
25