latitude and longitude describe locations on the earth with respect to the equator and prime meridian. the…
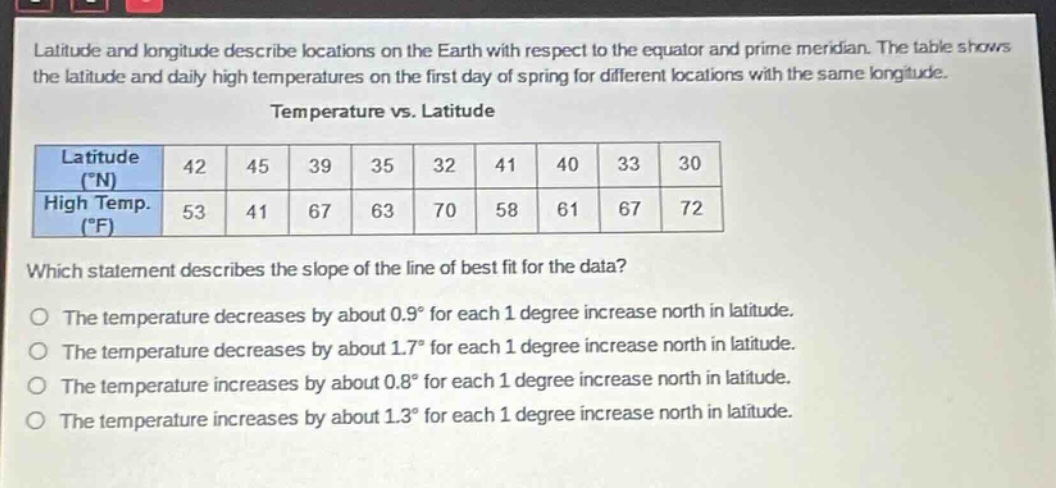
latitude and longitude describe locations on the earth with respect to the equator and prime meridian. the table shows the latitude and daily high temperatures on the first day of spring for different locations with the same longitude.\ntemperature vs. latitude\n|latitude (°n)|42|45|39|35|32|41|40|33|30|\n|high temp. (°f)|53|41|67|63|70|58|61|67|72|\nwhich statement describes the slope of the line of best fit for the data?\no the temperature decreases by about 0.9° for each 1 degree increase north in latitude.\no the temperature decreases by about 1.7° for each 1 degree increase north in latitude.\no the temperature increases by about 0.8° for each 1 degree increase north in latitude.\no the temperature increases by about 1.3° for each 1 degree increase north in latitude.
Answer
Explanation:
Step1: Recall slope concept
The slope of the line of best - fit in a regression context represents the change in the dependent variable (temperature) for a unit change in the independent variable (latitude). If the slope is negative, the dependent variable decreases as the independent variable increases. If the slope is positive, the dependent variable increases as the independent variable increases.
Step2: Observe data trend
As the latitude (in degrees north) increases from 30 to 45, the high temperature values decrease from 72 to 41.
Step3: Calculate approximate slope
We can use two points ((x_1,y_1)=(30,72)) and ((x_2,y_2)=(45,41)). The slope formula is (m=\frac{y_2 - y_1}{x_2 - x_1}). [m=\frac{41 - 72}{45 - 30}=\frac{- 31}{15}\approx - 2.07] If we use other pairs of points, for example, ((x_1,y_1)=(32,70)) and ((x_2,y_2)=(42,53)) [m=\frac{53 - 70}{42 - 32}=\frac{-17}{10}=-1.7]
Answer:
The temperature decreases by about 1.7° for each 1 degree increase north in latitude.