lawn care\ndays after treatment number of weeds\n2 100\n4 26\n6 6\n8 2\n10 1\nbased on the graph of the…
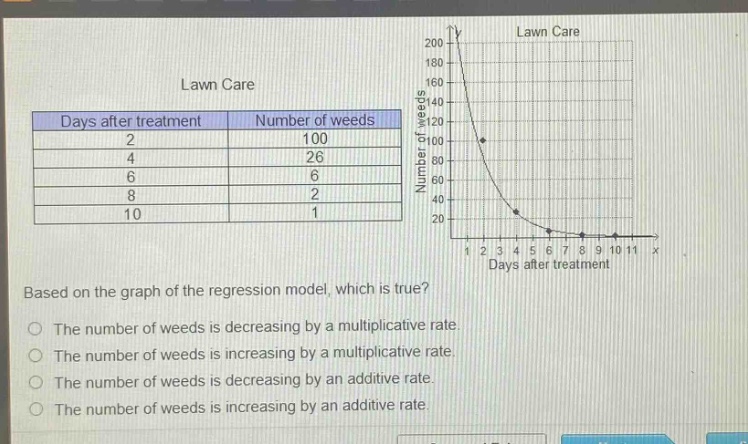
lawn care\ndays after treatment number of weeds\n2 100\n4 26\n6 6\n8 2\n10 1\nbased on the graph of the regression model, which is true?\nthe number of weeds is decreasing by a multiplicative rate.\nthe number of weeds is increasing by a multiplicative rate.\nthe number of weeds is decreasing by an additive rate.\nthe number of weeds is increasing by an additive rate.
Answer
Answer:
The number of weeds is decreasing by a multiplicative rate.
Explanation:
Step1: Analyze the data trend
As days after treatment increase from 2 to 10, number of weeds decreases from 100 to 1.
Step2: Check multiplicative or additive
If it were additive decrease, the difference between consecutive weed - counts would be constant. But (100 - 26=74), (26 - 6 = 20), not constant. If it were multiplicative decrease, we can check ratios. (\frac{26}{100}=0.26), (\frac{6}{26}\approx0.23), (\frac{2}{6}\approx0.33), (\frac{1}{2} = 0.5). The ratios are not exactly the same due to possible data variability, but the general trend shows a multiplicative decrease as the number of weeds is shrinking by a factor each time. So the number of weeds is decreasing by a multiplicative rate.