length and period of pendulums the graph shows the relationship between the length, x, in meters, of a…
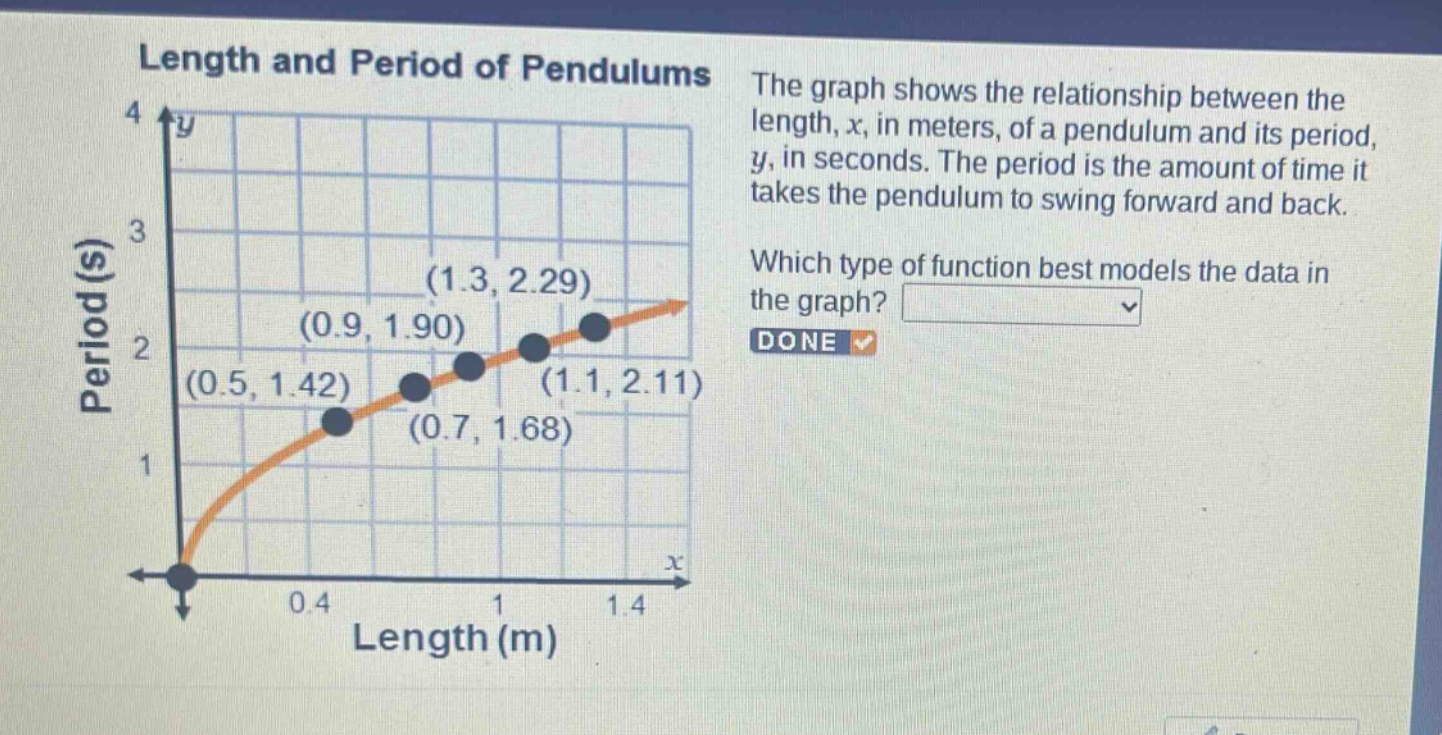
length and period of pendulums the graph shows the relationship between the length, x, in meters, of a pendulum and its period, y, in seconds. the period is the amount of time it takes the pendulum to swing forward and back. which type of function best models the data in the graph? done
Answer
Explanation:
Step1: Observe the graph shape
The graph is a smooth - rising curve that does not look like a linear, exponential, or logarithmic function at first glance. The relationship between the length of a pendulum and its period is modeled by a square - root function in physics. Mathematically, when we look at the general form of functions and how the data points are arranged, the curve has a shape similar to a square - root function $y = a\sqrt{x}+b$.
Step2: Recall function characteristics
Linear functions have a constant rate of change and form a straight line. Exponential functions have a rapid increase or decrease. Logarithmic functions have a different type of curve shape. The given curve has a non - constant rate of change that is characteristic of a square - root function.
Answer:
Square - root function