the lengths of movie files that are available for streaming are modeled using the normal distribution shown…
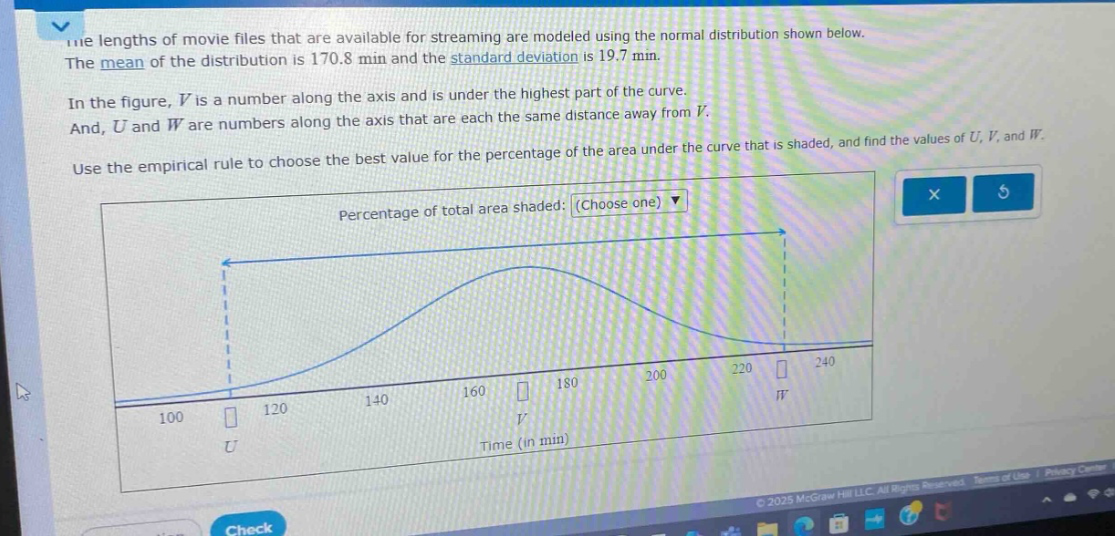
the lengths of movie files that are available for streaming are modeled using the normal distribution shown below. the mean of the distribution is 170.8 min and the standard - deviation is 19.7 min. in the figure, v is a number along the axis and is under the highest part of the curve. and, u and w are numbers along the axis that are each the same distance away from v. use the empirical rule to choose the best value for the percentage of the area under the curve that is shaded, and find the values of u, v, and w. percentage of total area shaded: (choose one)
Answer
Answer:
Percentage of total area shaded: 95% $U = 131.4$ min, $V = 170.8$ min, $W = 210.2$ min
Explanation:
Step1: Recall empirical rule
For normal - distribution, about 95% of data lies within 2 standard deviations of the mean.
Step2: Identify the mean
The mean $\mu=170.8$ min, so $V = 170.8$ min.
Step3: Calculate $U$
$U=\mu - 2\sigma$, where $\sigma = 19.7$ min. So $U=170.8-2\times19.7=170.8 - 39.4 = 131.4$ min.
Step4: Calculate $W$
$W=\mu + 2\sigma$. So $W=170.8 + 2\times19.7=170.8+39.4 = 210.2$ min.