leo tracked the number of points he scored in basketball games this season. he made a histogram to display…
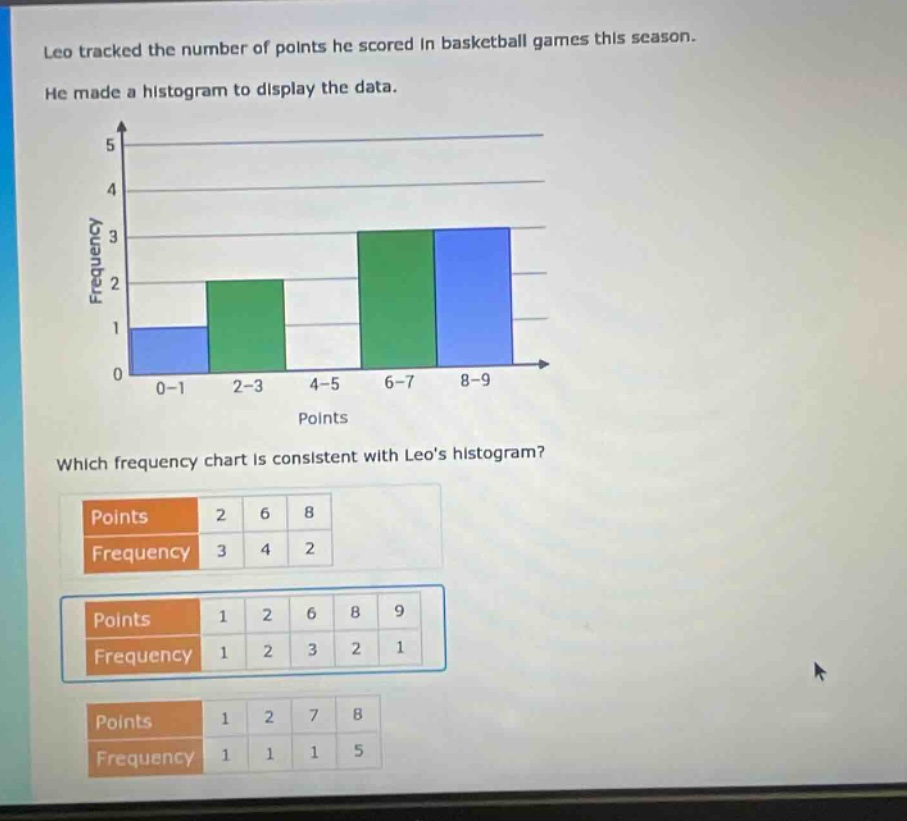
leo tracked the number of points he scored in basketball games this season. he made a histogram to display the data. which frequency chart is consistent with leos histogram? points 2 6 8 frequency 3 4 2 points 1 2 6 8 9 frequency 1 2 3 2 1 points 1 2 7 8 frequency 1 1 1 5
Answer
Explanation:
Step1: Analyze histogram frequencies
From the histogram, the frequency for the 0 - 1 points range is 1, for 2 - 3 points range is 2, for 6 - 7 points range is 3, and for 8 - 9 points range is 3.
Step2: Check each frequency - chart option
- For the first option: The points and frequencies do not match the histogram frequencies for the given ranges.
- For the second option: The frequency of 1 for point 1 is in the 0 - 1 range, frequency of 2 for point 2 is in 2 - 3 range, frequency of 3 for point 6 is in 6 - 7 range, frequency of 2 for point 8 and 1 for point 9 are in 8 - 9 range which matches the histogram frequencies.
- For the third option: The frequencies do not match the histogram frequencies for the given ranges.
Answer:
Points: 1, 2, 6, 8, 9; Frequency: 1, 2, 3, 2, 1