liam designed a survey to find out how many pets each student in his class had. number of pets 0 4 1 5 2 1 6…
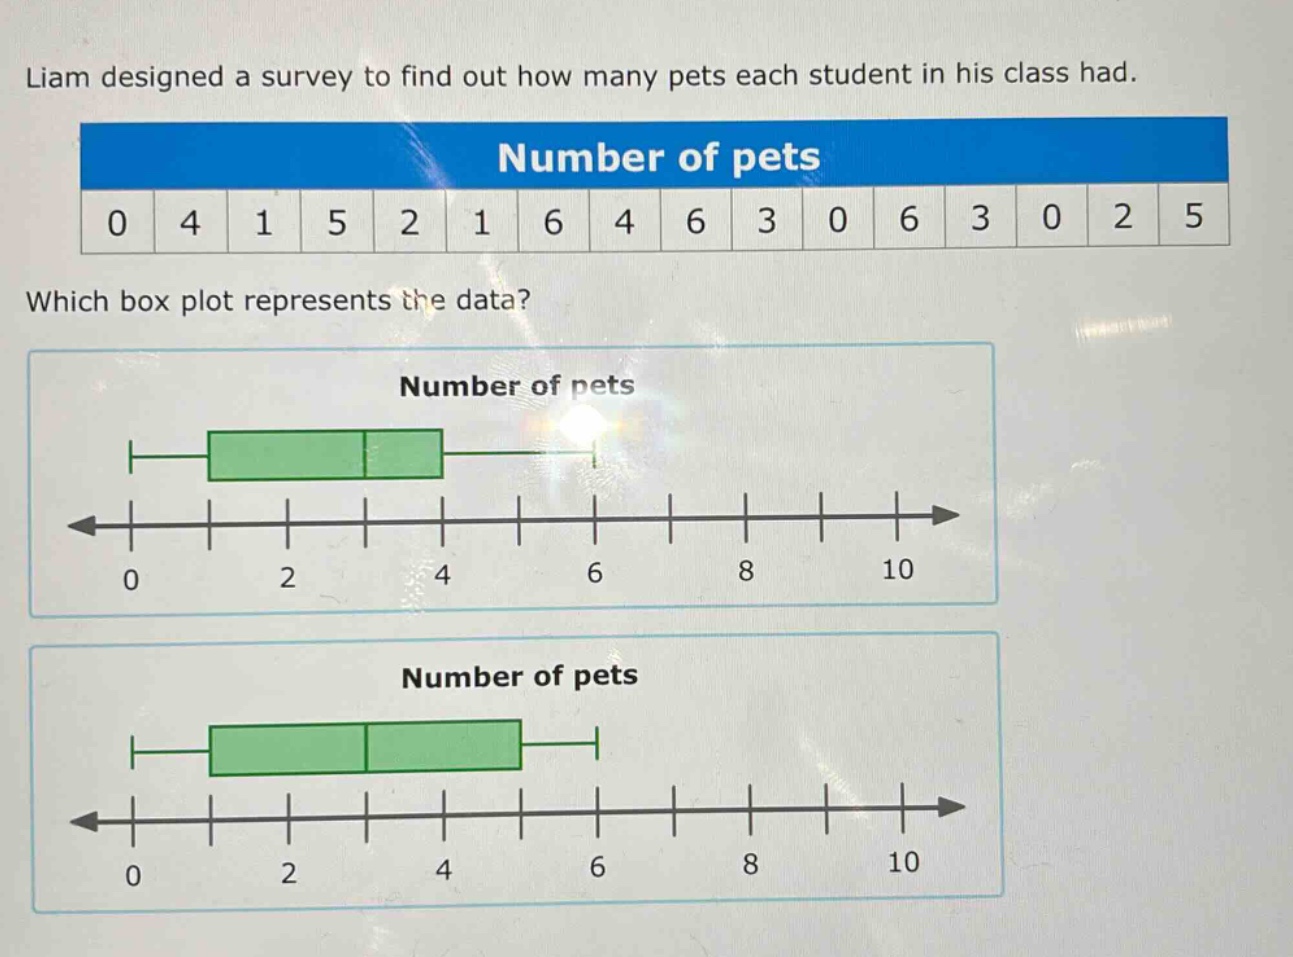
liam designed a survey to find out how many pets each student in his class had. number of pets 0 4 1 5 2 1 6 4 6 3 0 6 3 0 2 5 which box plot represents the data? number of pets 0 2 4 6 8 10 number of pets 0 2 4 6 8 10
Answer
Explanation:
Step1: Arrange data in ascending order
0, 0, 0, 1, 1, 2, 2, 3, 3, 4, 4, 5, 5, 6, 6, 6
Step2: Find the median (Q2)
There are 16 data - points. The median is the average of the 8th and 9th ordered values. $\frac{3 + 3}{2}=3$.
Step3: Find the lower half of data
0, 0, 0, 1, 1, 2, 2, 3. The median of the lower - half (Q1) is the average of the 4th and 5th ordered values in the lower - half. $\frac{1+1}{2}=1$.
Step4: Find the upper half of data
4, 4, 5, 5, 6, 6, 6. The median of the upper - half (Q3) is the average of the 4th and 5th ordered values in the upper - half. $\frac{5 + 5}{2}=5$.
Step5: Identify the minimum and maximum
The minimum value is 0 and the maximum value is 6.
Step6: Analyze box - plots
The box in a box - plot represents the inter - quartile range (IQR) from Q1 to Q3. The line inside the box is Q2. The whiskers extend to the minimum and maximum values. The correct box - plot should have the box starting at 1, ending at 5, the line inside the box at 3, and whiskers extending to 0 and 6.
Answer:
The box - plot with the box starting at 1, ending at 5, the line inside the box at 3, and whiskers extending to 0 and 6. (Since no options are labeled, a description is given. If there were labeled options, we could point out the correct one based on the above characteristics).