which is most likely the correlation coefficient for the set of data shown?\n-0.65\n-0.19\n0.19\n0.75
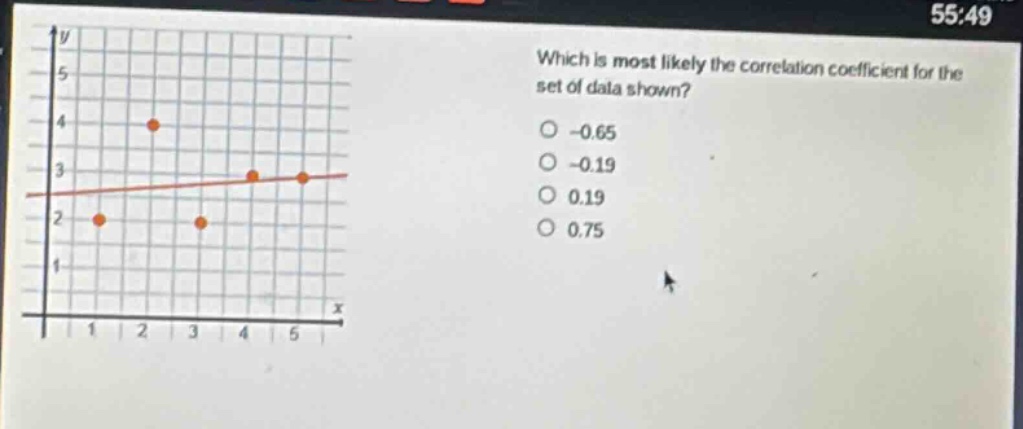
which is most likely the correlation coefficient for the set of data shown?\n-0.65\n-0.19\n0.19\n0.75
Answer
Explanation:
Step1: Observe the scatter - plot trend
The points in the scatter - plot show a positive linear trend. As (x) increases, (y) generally increases. So the correlation coefficient (r>0).
Step2: Evaluate the strength of the linear relationship
The points are not tightly clustered around the line, so the linear relationship is weak. A value of (r = 0.75) represents a strong positive linear relationship, which is not the case here. A value close to (0) represents a weak linear relationship. Among the positive values, (0.19) indicates a weak positive linear relationship.
Answer:
0.19