which is most likely the correlation coefficient for the set of data shown? -0.872 -0.191 0.191 0.872
which is most likely the correlation coefficient for the set of data shown? -0.872 -0.191 0.191 0.872
Answer
Explanation:
Step1: Identify the trend
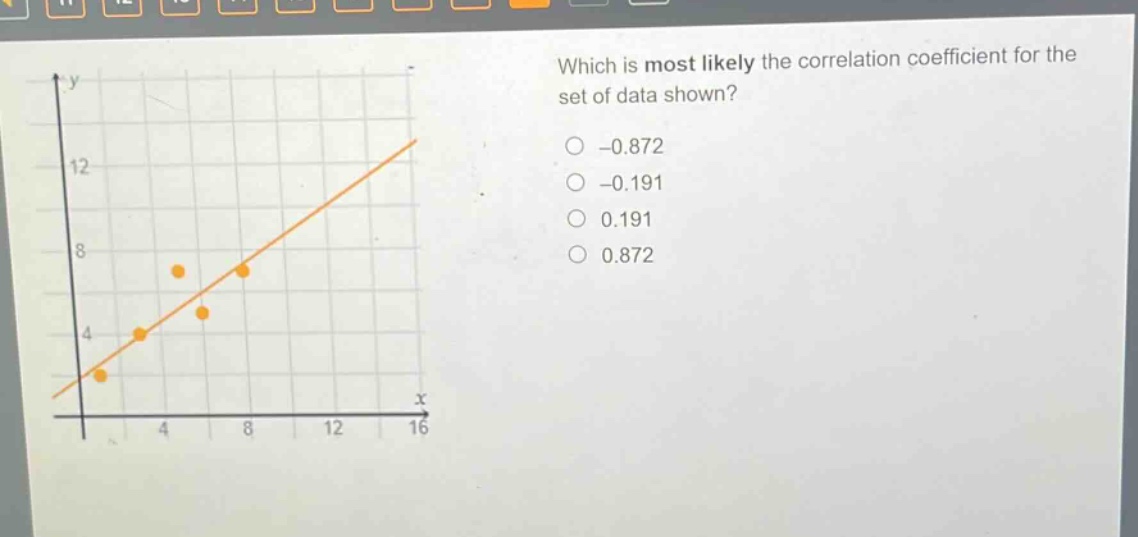
The scatter - plot shows a positive linear trend. As the value of (x) increases, the value of (y) generally increases.
Step2: Recall correlation coefficient properties
A positive linear relationship has a positive correlation coefficient ((r>0)). A strong positive linear relationship has a correlation coefficient close to (1), and a weak positive linear relationship has a correlation coefficient close to (0) but positive.
Step3: Evaluate options
Options - 0.872 and - 0.191 are negative, so they can be eliminated. Among 0.191 and 0.872, since the points in the scatter - plot seem to follow the line quite well, indicating a relatively strong positive relationship, the correlation coefficient should be close to 1. So 0.872 is more appropriate.
Answer:
0.872