a line of best fit was drawn to the plotted points in a data set below. based on the line of best fit, for…
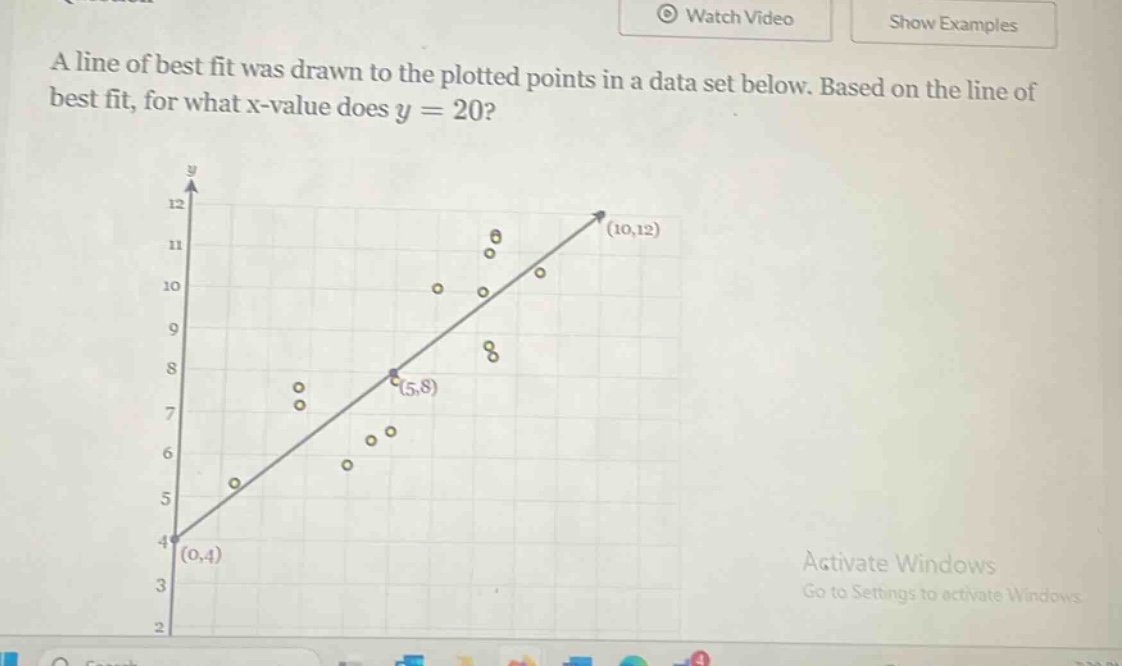
a line of best fit was drawn to the plotted points in a data set below. based on the line of best fit, for what x - value does y = 20?
Answer
Explanation:
Step1: Find the slope of the line
The slope $m$ of a line passing through two points $(x_1,y_1)$ and $(x_2,y_2)$ is given by $m=\frac{y_2 - y_1}{x_2 - x_1}$. Using the points $(0,4)$ and $(5,8)$, we have $m=\frac{8 - 4}{5-0}=\frac{4}{5}=0.8$.
Step2: Find the equation of the line
The equation of a line in slope - intercept form is $y=mx + b$, where $m$ is the slope and $b$ is the y - intercept. Since the line passes through $(0,4)$, $b = 4$. So the equation of the line is $y=0.8x + 4$.
Step3: Solve for $x$ when $y = 20$
Substitute $y = 20$ into the equation $y=0.8x + 4$. We get $20=0.8x+4$. First, subtract 4 from both sides: $20 - 4=0.8x$, so $16 = 0.8x$. Then divide both sides by 0.8: $x=\frac{16}{0.8}=20$.
Answer:
20