a line of best fit is drawn for the set of points shown on the graph. which point is an approximate…
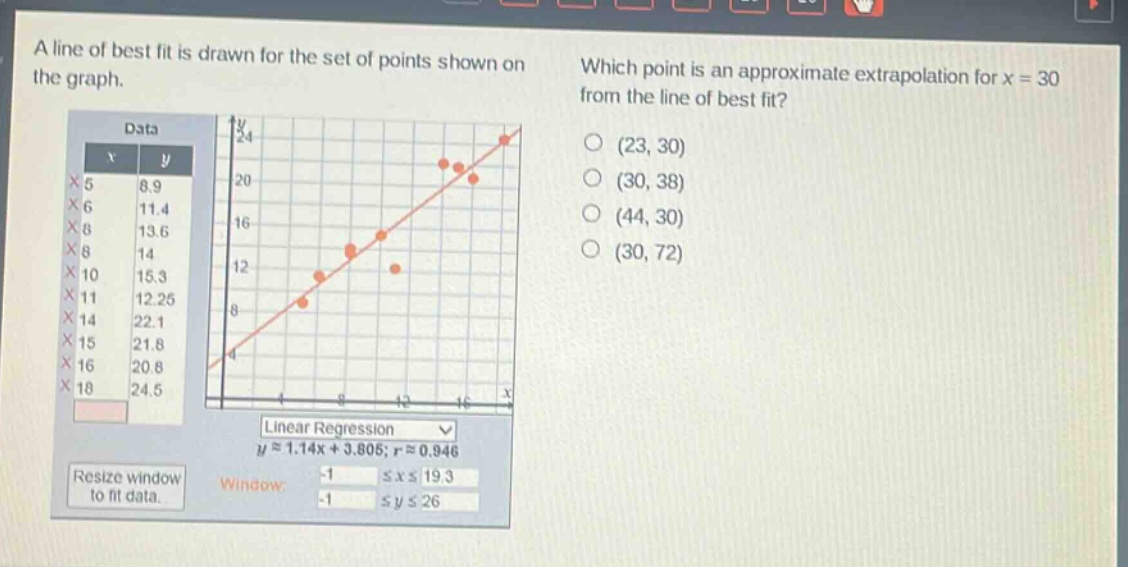
a line of best fit is drawn for the set of points shown on the graph. which point is an approximate extrapolation for x = 30 from the line of best fit? data x y 5 8.9 6 11.4 8 13.6 8 14 10 15.3 11 12.25 14 22.1 15 21.8 16 20.8 18 24.5 linear regression y ≈ 1.14x + 3.805; r ≈ 0.946 window: -1 ≤ x ≤ 19.3 -1 ≤ y ≤ 26 (23, 30) (30, 38) (44, 30) (30, 72)
Answer
Explanation:
Step1: Identify the regression equation
The line - of - best - fit equation is $y\approx1.14x + 3.805$.
Step2: Substitute $x = 30$ into the equation
Substitute $x = 30$ into $y=1.14x + 3.805$. Then $y=1.14\times30+3.805$. First, calculate $1.14\times30 = 34.2$. Then $y=34.2+3.805=38.005\approx38$.
Answer:
(30, 38)