a line graph does not: a. show trends clearly b. allow viewers to make predictions about data d. show…
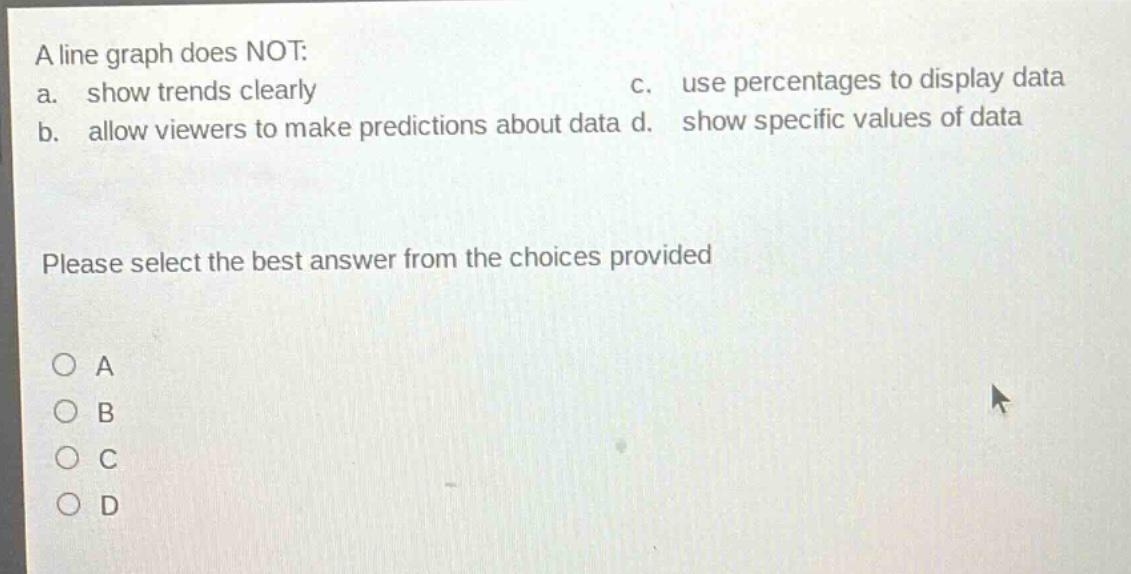
a line graph does not: a. show trends clearly b. allow viewers to make predictions about data d. show specific values of data c. use percentages to display data please select the best answer from the choices provided a b c d
Answer
Brief Explanations:
Line graphs are good at showing trends, allowing predictions, and showing specific data - values. Pie - charts are more commonly used to display data as percentages.
Answer:
C. use percentages to display data