this line graph shows the united states population from 1800 to 2000. what change does this graph show from…
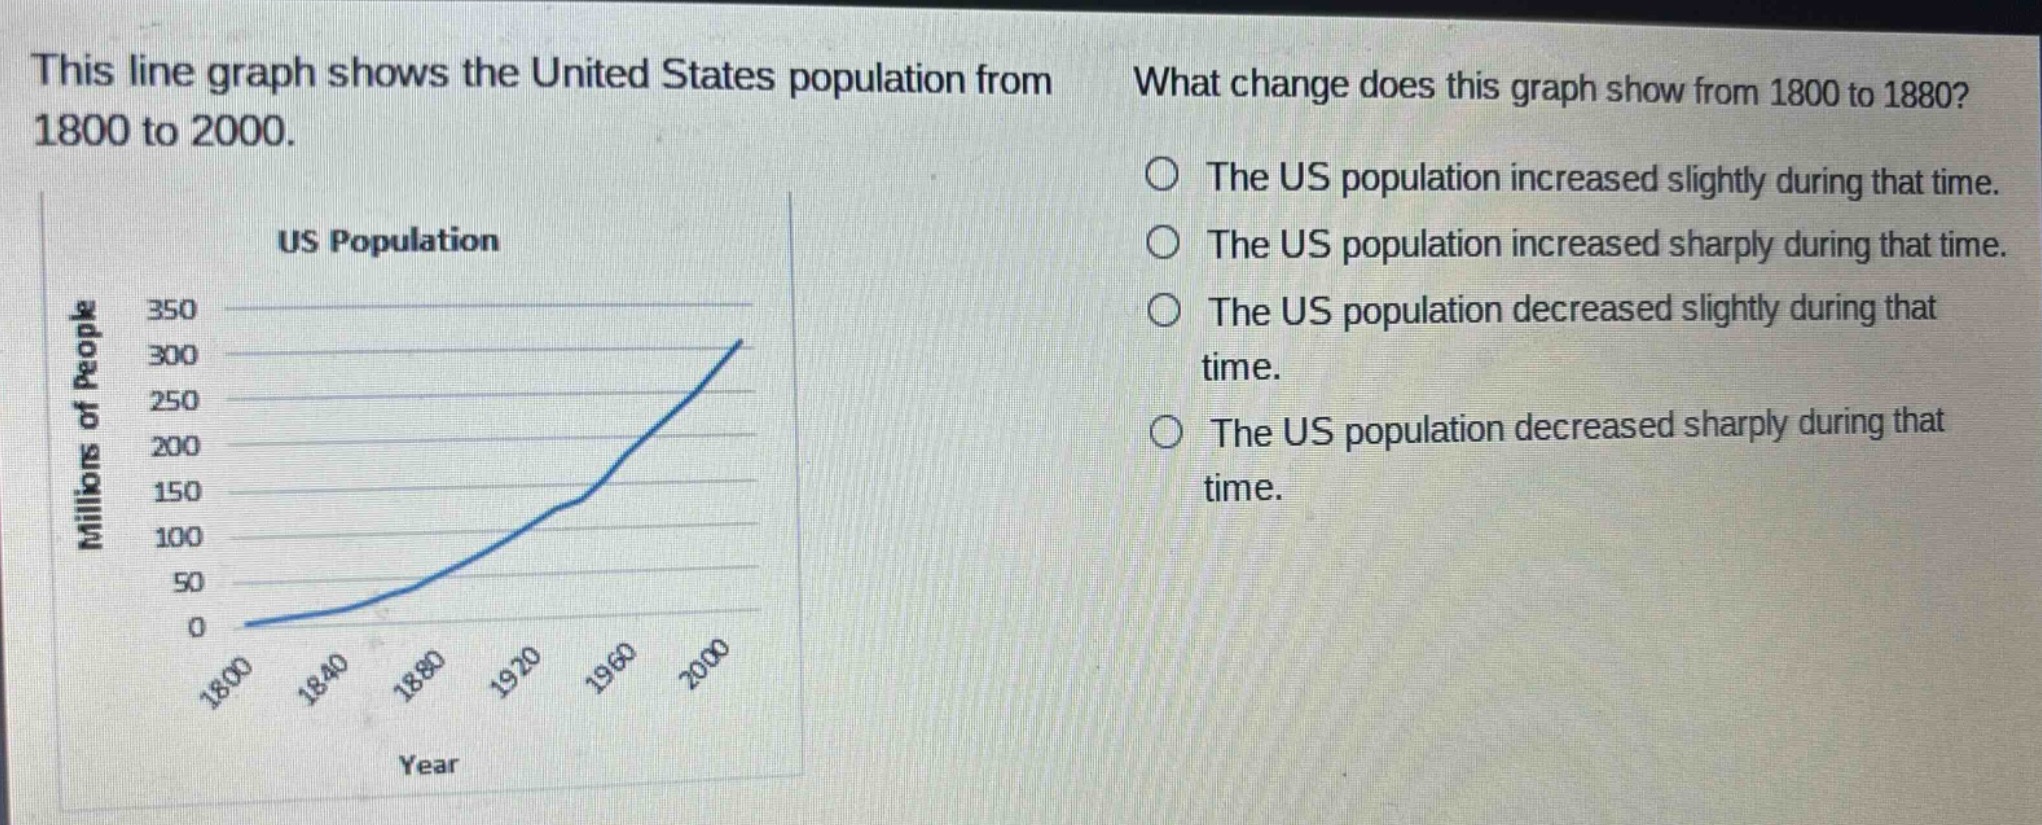
this line graph shows the united states population from 1800 to 2000. what change does this graph show from 1800 to 1880? the us population increased slightly during that time. the us population increased sharply during that time. the us population decreased slightly during that time. the us population decreased sharply during that time.
Answer
Explanation:
Step1: Analyze the trend of the line graph
The line graph shows the US population over time. From 1800 to 1880, observe the direction and steepness of the line.
Step2: Determine the nature of population change
Since the line is going upwards (indicating an increase) and the slope is relatively steep (not a gentle increase), it means the population increased sharply.
Answer:
The US population increased sharply during that time.