which line is a linear model for the data?
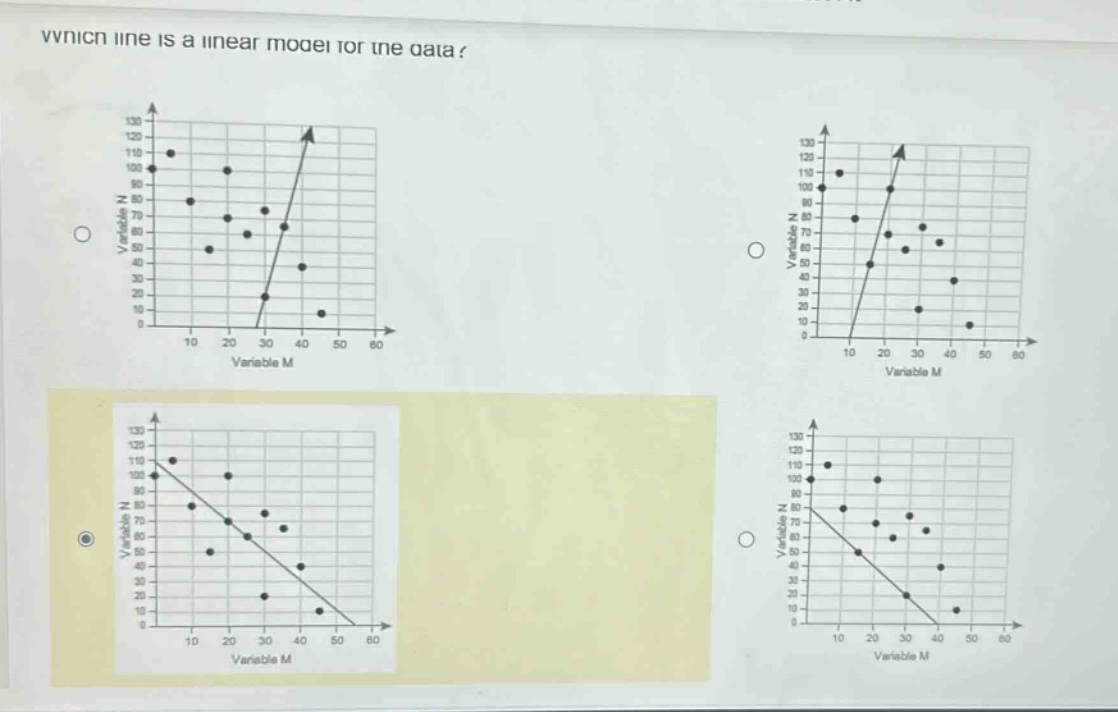
which line is a linear model for the data?
Answer
Answer:
The line that best fits the data points in a scatter - plot is the one that minimizes the sum of the squared vertical distances from the points to the line. Without specific calculations of the least - squares regression line, visually, the line that passes through the "center" of the data points is the best linear model. Based on the visual appearance of the given scatter - plots, the line in the bottom - left plot seems to be a better linear model as it appears to be closer to more data points compared to the others.
Explanation:
Step1: Understand linear model concept
A linear model is a straight line that represents the relationship between two variables.
Step2: Visual inspection
Look at how close the line is to the data points.
Step3: Select the best fit
The line in the bottom - left plot has more points closer to it.