which line plot displays a data set with an outlier?
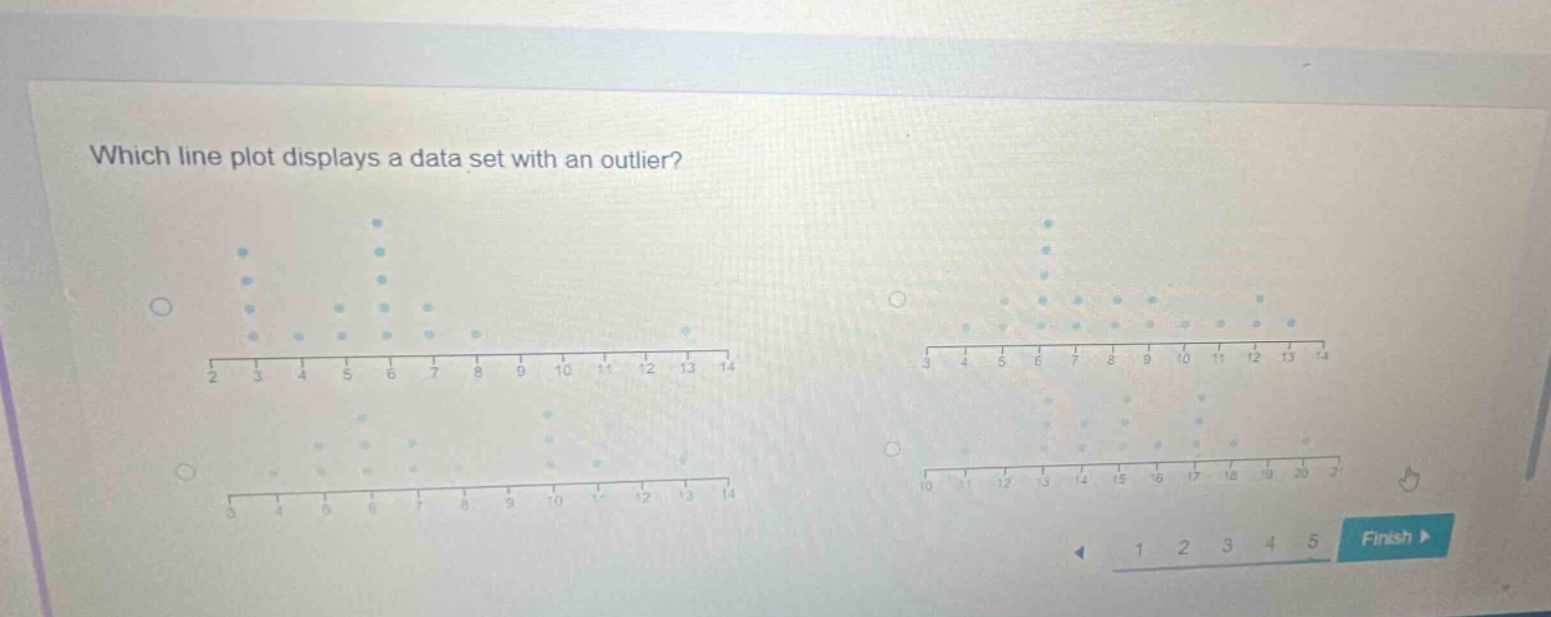
which line plot displays a data set with an outlier?
Answer
Explanation:
Step1: Recall outlier definition
An outlier is a data - point that is far from other data - points.
Step2: Examine each line - plot
In the first line - plot, all the data points are clustered relatively close together. In the second line - plot, most of the data points are in the range of 4 - 13, but there is a single data point at 3 which is far from the main cluster of data. In the third line - plot, the data points are evenly distributed without any extreme values. In the fourth line - plot, the data points are also clustered together without any obvious outliers.
Answer:
The second line - plot (the one with most points in 4 - 13 and a single point at 3)