this line plot shows data about trails in a state park. what is true about the data in this line plot…
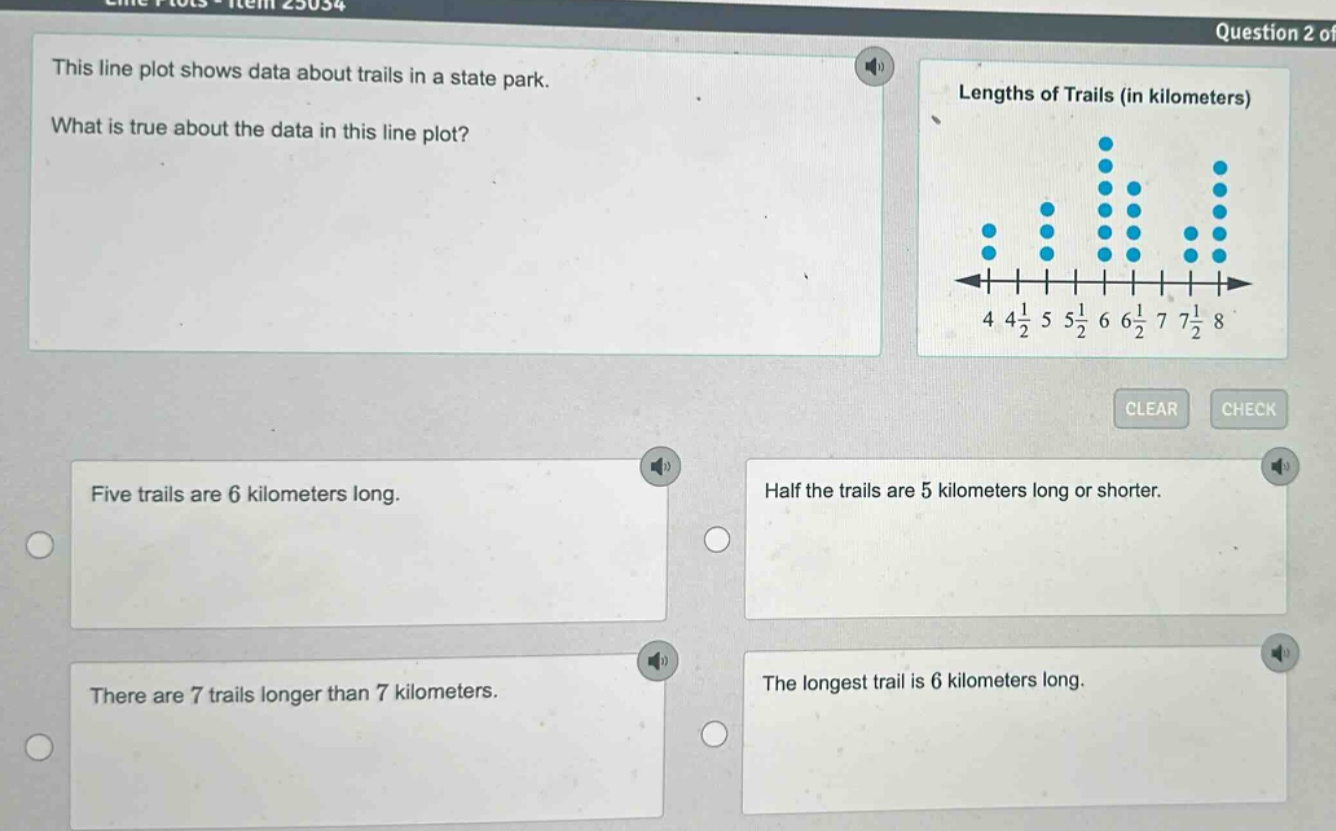
this line plot shows data about trails in a state park. what is true about the data in this line plot? lengths of trails (in kilometers) five trails are 6 kilometers long. half the trails are 5 kilometers long or shorter. there are 7 trails longer than 7 kilometers. the longest trail is 6 kilometers long.
Answer
Explanation:
Step1: Count data - points for 6 km
Count the number of dots above 6 on the line - plot. There are 5 dots above 6, so there are 5 trails that are 6 kilometers long.
Step2: Analyze 5 km or shorter
Count the number of dots at 4, 4.5, and 5. There are 2 + 3+ 4 = 9 dots. The total number of dots is 2+3 + 4+5+4+2+5 = 25. 9 is not half of 25.
Step3: Analyze trails longer than 7 km
Count the number of dots at 7.5 and 8. There are 2 + 5=7 dots.
Step4: Analyze longest trail
The longest - length on the line - plot is 8 km, not 6 km.
Answer:
A. Five trails are 6 kilometers long. C. There are 7 trails longer than 7 kilometers.