which line on the scatter plot is a good line of fit for the given data? (a) line a (b) line b (c) line c…
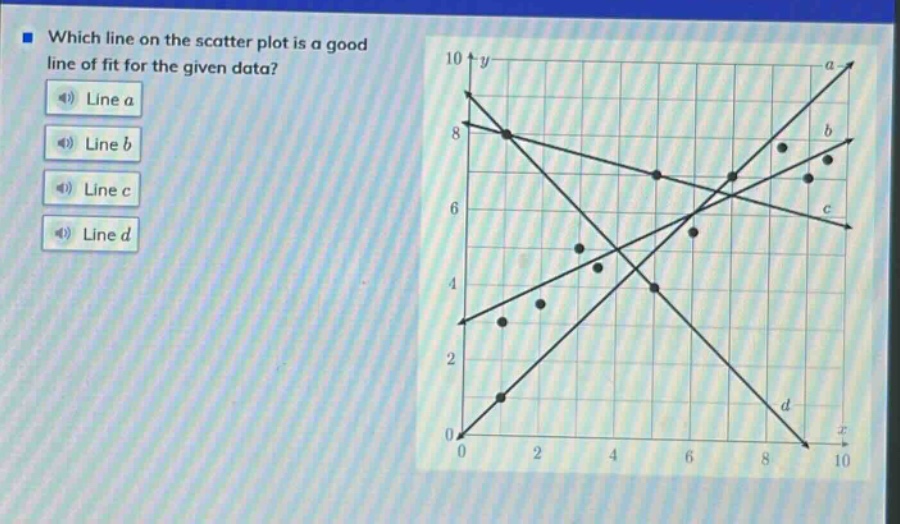
which line on the scatter plot is a good line of fit for the given data? (a) line a (b) line b (c) line c (d) line d
Answer
Explanation:
Step1: Understand line - of - fit concept
A good line of fit minimizes the distance between the data points and the line.
Step2: Analyze each line
Line a: It seems to deviate a lot from many data points. Line b: It passes through the middle of the cluster of data points and has a good balance of points above and below it. Line c: It does not represent the overall trend well as it is far from some points. Line d: It also does not follow the general pattern of the data points well.
Answer:
Line b