is the line shown on the scatter plot a good line of fit for the given data?\nyes, because the line passes…
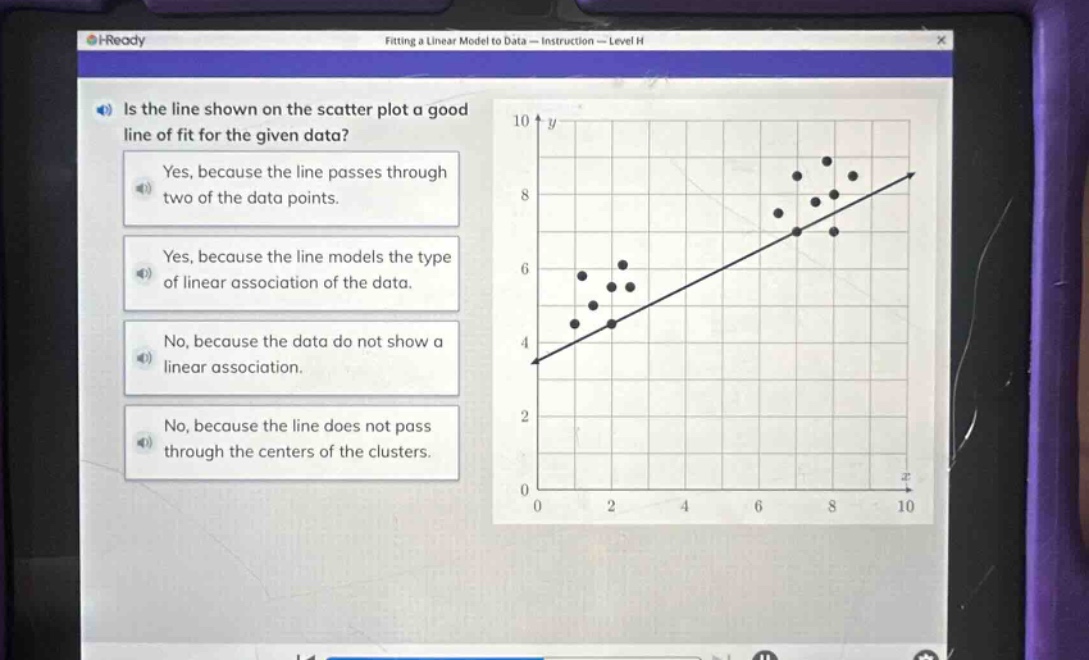
is the line shown on the scatter plot a good line of fit for the given data?\nyes, because the line passes through two of the data points.\nyes, because the line models the type of linear association of the data.\nno, because the data do not show a linear association.\nno, because the line does not pass through the centers of the clusters.
Answer
Brief Explanations:
A good line of fit in a scatter - plot should model the overall linear association of the data. Just passing through two points is not sufficient. The data in the scatter - plot shows a linear upward trend and the given line follows this trend.
Answer:
Yes, because the line models the type of linear association of the data.