is the line shown on the scatter plot a good line of fit for the given data?\nyes, because the line is close…
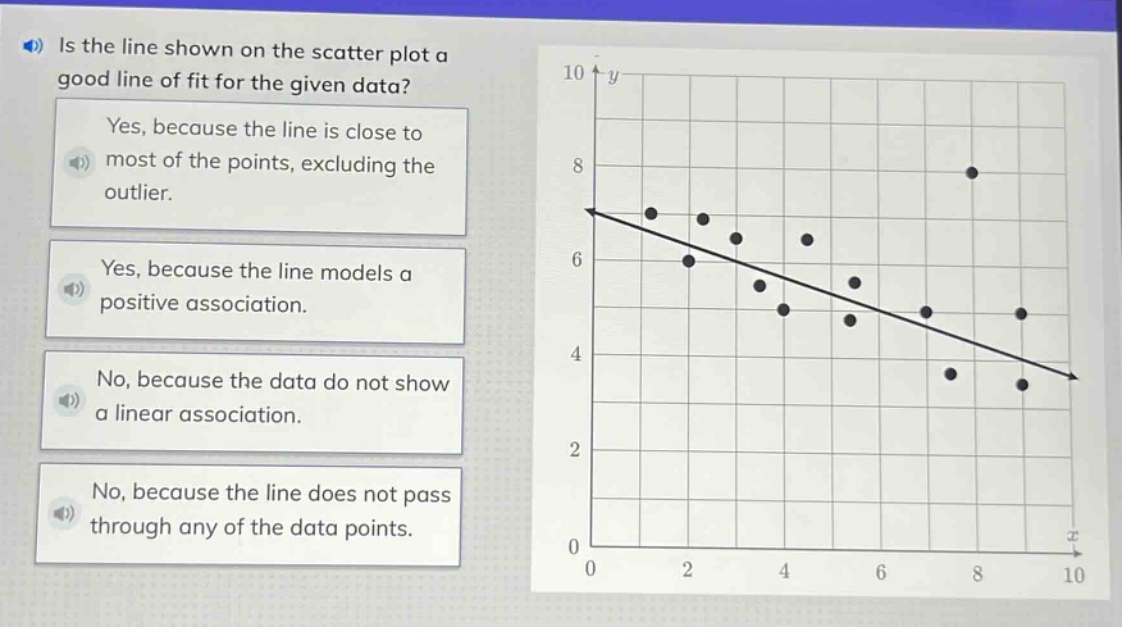
is the line shown on the scatter plot a good line of fit for the given data?\nyes, because the line is close to most of the points, excluding the outlier.\nyes, because the line models a positive association.\nno, because the data do not show a linear association.\nno, because the line does not pass through any of the data points.
Answer
Explanation:
Step 1: Analyze the scatter plot trend
The line has a negative slope, and most points (excluding the outlier at the top right) are close to the line, indicating a linear trend.
Step 2: Evaluate each option
- Option A: Correct. The line fits most points, ignoring the outlier.
- Option B: Incorrect. The line shows a negative, not positive, association.
- Option C: Incorrect. Data shows a linear trend despite the outlier.
- Option D: Incorrect. A line of fit doesn’t need to pass through data points.
Answer:
A. Yes, because the line is close to most of the points, excluding the outlier.