is the line shown on the scatter plot a good line of fit for the given data? yes, because the line is close…
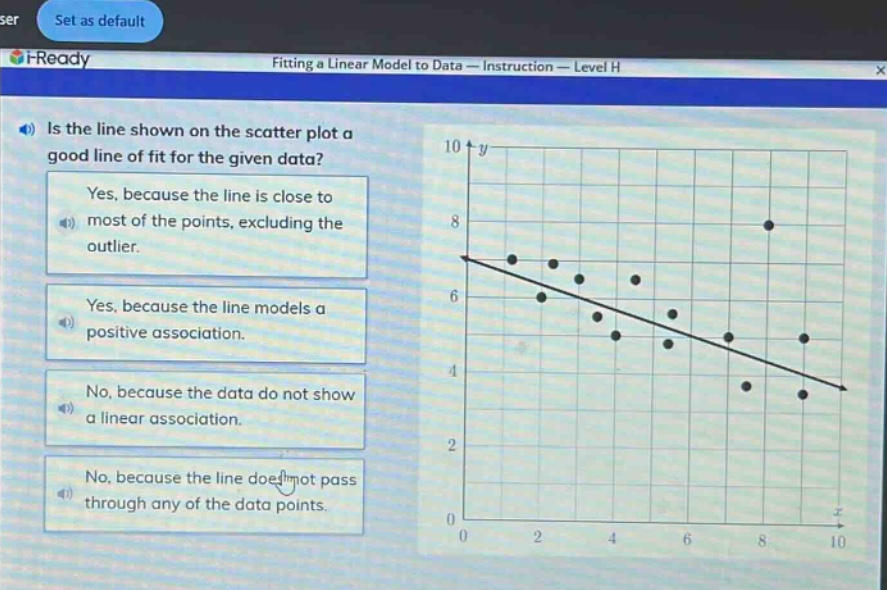
is the line shown on the scatter plot a good line of fit for the given data? yes, because the line is close to most of the points, excluding the outlier. yes, because the line models a positive association. no, because the data do not show a linear association. no, because the line does not pass through any of the data points.
Answer
Explanation:
Step1: Analyze line - point relationship
A good line of fit should be close to most data points. Here, the line is close to most points excluding the outlier.
Step2: Check association type
The line shows a negative association, not positive, so the positive - association reason is wrong. Also, the data does show a linear trend. And a line of fit doesn't have to pass through data points.
Answer:
Yes, because the line is close to most of the points, excluding the outlier.