lisa and jen are each reading a different 250 - page book consisting of 10 chapters. which statistics would…
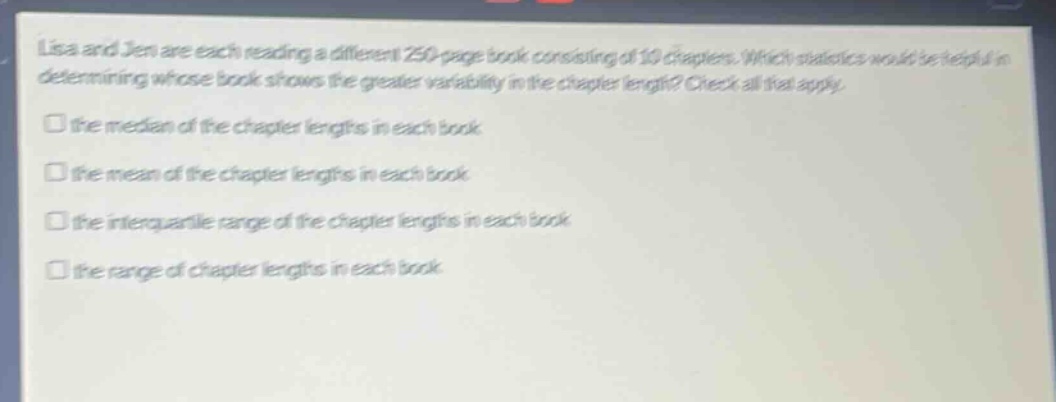
lisa and jen are each reading a different 250 - page book consisting of 10 chapters. which statistics would be helpful in determining whose book shows the greater variability in the chapter length? check all that apply.\n□ the median of the chapter lengths in each book\n□ the mean of the chapter lengths in each book\n□ the interquartile range of the chapter lengths in each book\n□ the range of chapter lengths in each book
Answer
Explanation:
Step1: Understand measures of variability
Measures of variability show how spread - out data is.
Step2: Analyze median
Median is a measure of central tendency, not variability. It gives the middle - value and doesn't show spread.
Step3: Analyze mean
Mean is also a measure of central tendency. It gives the average value and not the spread of data.
Step4: Analyze interquartile range
Interquartile range (IQR) is a measure of variability. It represents the range of the middle 50% of the data and shows how spread out the middle portion of the data is.
Step5: Analyze range
Range is a measure of variability. It is calculated as the difference between the maximum and minimum values in the data set and shows the overall spread of the data.
Answer:
the interquartile range of the chapter lengths in each book, the range of chapter lengths in each book