listed in the accompanying table are heights (in.) of mothers and their first daughters. the data pairs are…
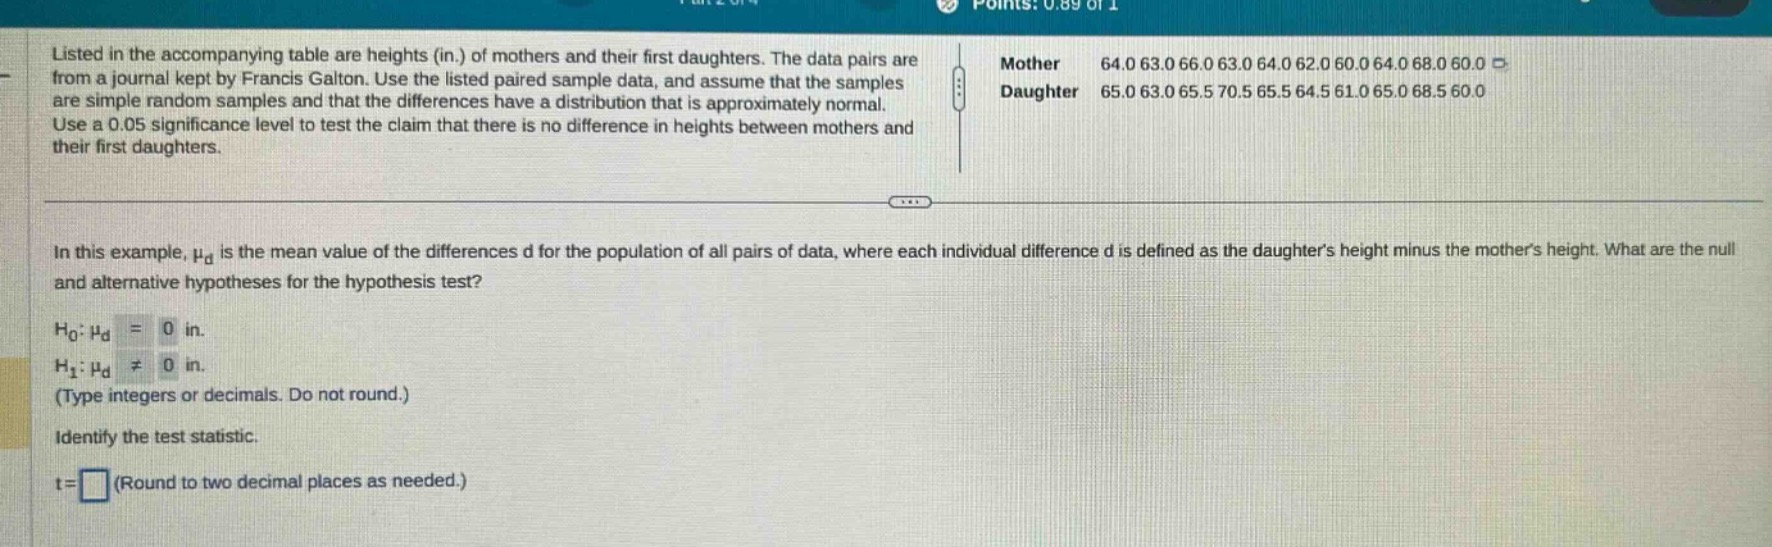
listed in the accompanying table are heights (in.) of mothers and their first daughters. the data pairs are from a journal kept by francis galton. use the listed paired - sample data, and assume that the samples are simple random samples and that the differences have a distribution that is approximately normal. use a 0.05 significance level to test the claim that there is no difference in heights between mothers and their first daughters.\nin this example, $mu_d$ is the mean value of the differences d for the population of all pairs of data, where each individual difference d is defined as the daughters height minus the mothers height. what are the null and alternative hypotheses for the hypothesis test?\n$h_0:mu_d = 0$ in.\n$h_1:mu_d\neq0$ in.\n(type integers or decimals. do not round.)\nidentify the test statistic.\nt = (round to two decimal places as needed.)
Answer
Explanation:
Step1: Calculate the differences
Let $x_i$ be the mother's height and $y_i$ be the daughter's height. Calculate $d_i=y_i - x_i$ for each pair.
| Mother ($x_i$) | Daughter ($y_i$) | $d_i=y_i - x_i$ |
|---|---|---|
| 64.0 | 65.0 | 1.0 |
| 63.0 | 63.0 | 0.0 |
| 66.0 | 65.5 | - 0.5 |
| 63.0 | 70.5 | 7.5 |
| 64.0 | 65.5 | 1.5 |
| 62.0 | 64.5 | 2.5 |
| 60.0 | 61.0 | 1.0 |
| 64.0 | 65.0 | 1.0 |
| 68.0 | 68.5 | 0.5 |
| 60.0 | 60.0 | 0.0 |
Step2: Calculate the mean of the differences $\bar{d}$
$\bar{d}=\frac{\sum_{i = 1}^{n}d_i}{n}$, where $n = 10$ and $\sum_{i=1}^{10}d_i=1.0 + 0.0-0.5 + 7.5+1.5 + 2.5+1.0+1.0+0.5+0.0 = 15.5$ $\bar{d}=\frac{15.5}{10}=1.55$
Step3: Calculate the standard - deviation of the differences $s_d$
First, calculate $(d_i-\bar{d})^2$ for each $i$:
| $d_i$ | $(d_i - \bar{d})^2$ |
|---|---|
| 1.0 | $(1.0 - 1.55)^2=0.3025$ |
| 0.0 | $(0.0 - 1.55)^2 = 2.4025$ |
| - 0.5 | $(-0.5 - 1.55)^2=4.2025$ |
| 7.5 | $(7.5 - 1.55)^2 = 35.4025$ |
| 1.5 | $(1.5 - 1.55)^2=0.0025$ |
| 2.5 | $(2.5 - 1.55)^2 = 0.9025$ |
| 1.0 | $(1.0 - 1.55)^2=0.3025$ |
| 1.0 | $(1.0 - 1.55)^2=0.3025$ |
| 0.5 | $(0.5 - 1.55)^2=1.1025$ |
| 0.0 | $(0.0 - 1.55)^2=2.4025$ |
$\sum_{i = 1}^{n}(d_i-\bar{d})^2=0.3025+2.4025 + 4.2025+35.4025+0.0025+0.9025+0.3025+0.3025+1.1025+2.4025 = 47.325$
$s_d=\sqrt{\frac{\sum_{i = 1}^{n}(d_i-\bar{d})^2}{n - 1}}=\sqrt{\frac{47.325}{9}}\approx2.29$
Step4: Calculate the test - statistic $t$
The formula for the test - statistic in a paired - samples $t$ - test is $t=\frac{\bar{d}-\mu_d}{s_d/\sqrt{n}}$. Since $\mu_d = 0$ (from the null hypothesis), $n = 10$, $\bar{d}=1.55$ and $s_d\approx2.29$. $t=\frac{1.55-0}{2.29/\sqrt{10}}\approx\frac{1.55}{0.724}\approx2.14$
Answer:
$t = 2.14$