look at this data set.\n{(7, 51), (5, 32), (2, 17), (-3, -8), (1, 13), (-6, -24)}\nwhich equation most…
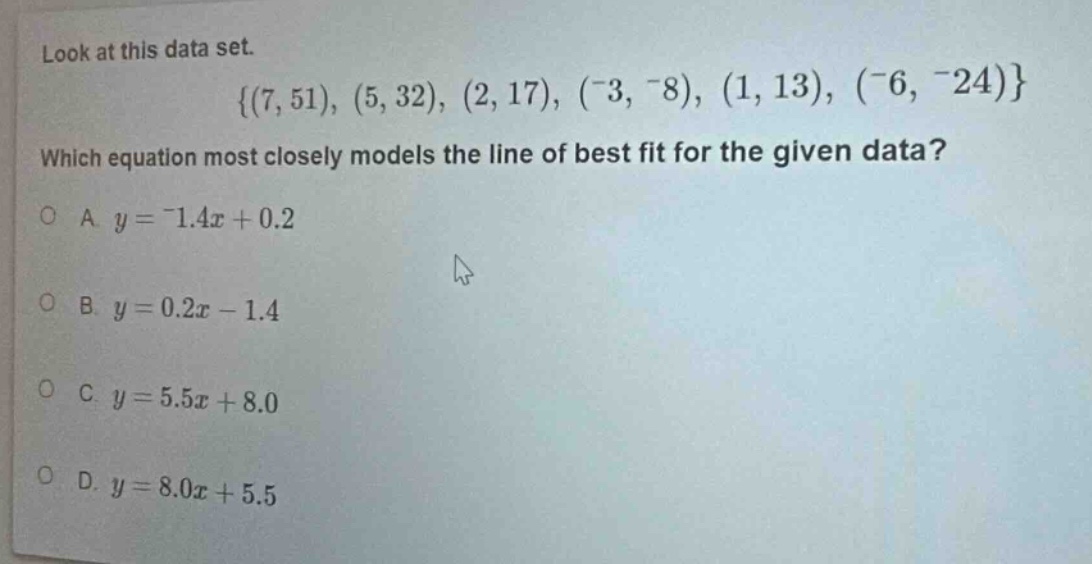
look at this data set.\n{(7, 51), (5, 32), (2, 17), (-3, -8), (1, 13), (-6, -24)}\nwhich equation most closely models the line of best fit for the given data?\na. y = -1.4x + 0.2\nb. y = 0.2x - 1.4\nc. y = 5.5x + 8.0\nd. y = 8.0x + 5.5
Answer
Explanation:
Step1: Calculate the average of x - values
Let the x - values be (x_1 = 7,x_2 = 5,x_3 = 2,x_4=-3,x_5 = 1,x_6=-6). The average (\bar{x}=\frac{7 + 5+2+( - 3)+1+( - 6)}{6}=\frac{6}{6}=1).
Step2: Calculate the average of y - values
Let the y - values be (y_1 = 51,y_2 = 32,y_3 = 17,y_4=-8,y_5 = 13,y_6=-24). The average (\bar{y}=\frac{51 + 32+17+( - 8)+13+( - 24)}{6}=\frac{71}{6}\approx11.83).
Step3: Calculate the slope
We can also use a quick - check method by substituting a few points into the equations. Let's take the point ((1,13)) For option A: When (x = 1), (y=-1.4\times1 + 0.2=-1.2\neq13) For option B: When (x = 1), (y=0.2\times1-1.4=-1.2\neq13) For option C: When (x = 1), (y=5.5\times1 + 8.0=13.5\approx13) For option D: When (x = 1), (y=8.0\times1+5.5 = 13.5) Let's take another point ((2,17)) For option C: When (x = 2), (y=5.5\times2+8.0=11 + 8.0=19) For option D: When (x = 2), (y=8.0\times2+5.5=16 + 5.5=21.5) If we consider the general trend of the data points and do a rough estimate of the slope and y - intercept, we can see that the line (y = 5.5x+8.0) is a better fit.
Answer:
C. (y = 5.5x + 8.0)